Ana / Recorte Brasil Design 21
Mapping Brazilian Design in 2021
In 2021, I partnered with a friend to explore design maturity and apply it to a volunteering project we were working on. As we dug deeper, we realized there were little to no official records or consolidated data about Brazilian design from 2014 onward. Our focus then shifted, and the project became an initiative to map and expand the understanding of Brazil's design landscape through data collection and visualization.
This project took us three years to complete and reflects both the importance and the effort involved in conducting independent research and fostering discussion.
Goals
Broad exploration of theme
Map the end-to-end design landscape in Brazil, covering education, professional market, scientific publishing, and the people who shape Brazilian design
Collect data on Brazilian Design
Gather and organize information about design in Brazil up to 2021 combining manual and automated methods, including desk researches, online survey and web-scraping of public databases
Generate insights, not images
Turn complex data into meaningful visual information, highlighting points to encourage discussion and critical reflection
Make the data accessible
Publish and make the data openly available for anyone to explore and use
Data collection
The data collection methods for this project varied depending on the subject being explored. Desk research and web scraping were used to gather quantitative information, while a survey was designed to collect both quantitative and qualitative insights from people.
The online survey was carefully structured to cover the desired areas, and its release was strategically planned to ensure it would reach a broader audience across a continental country.
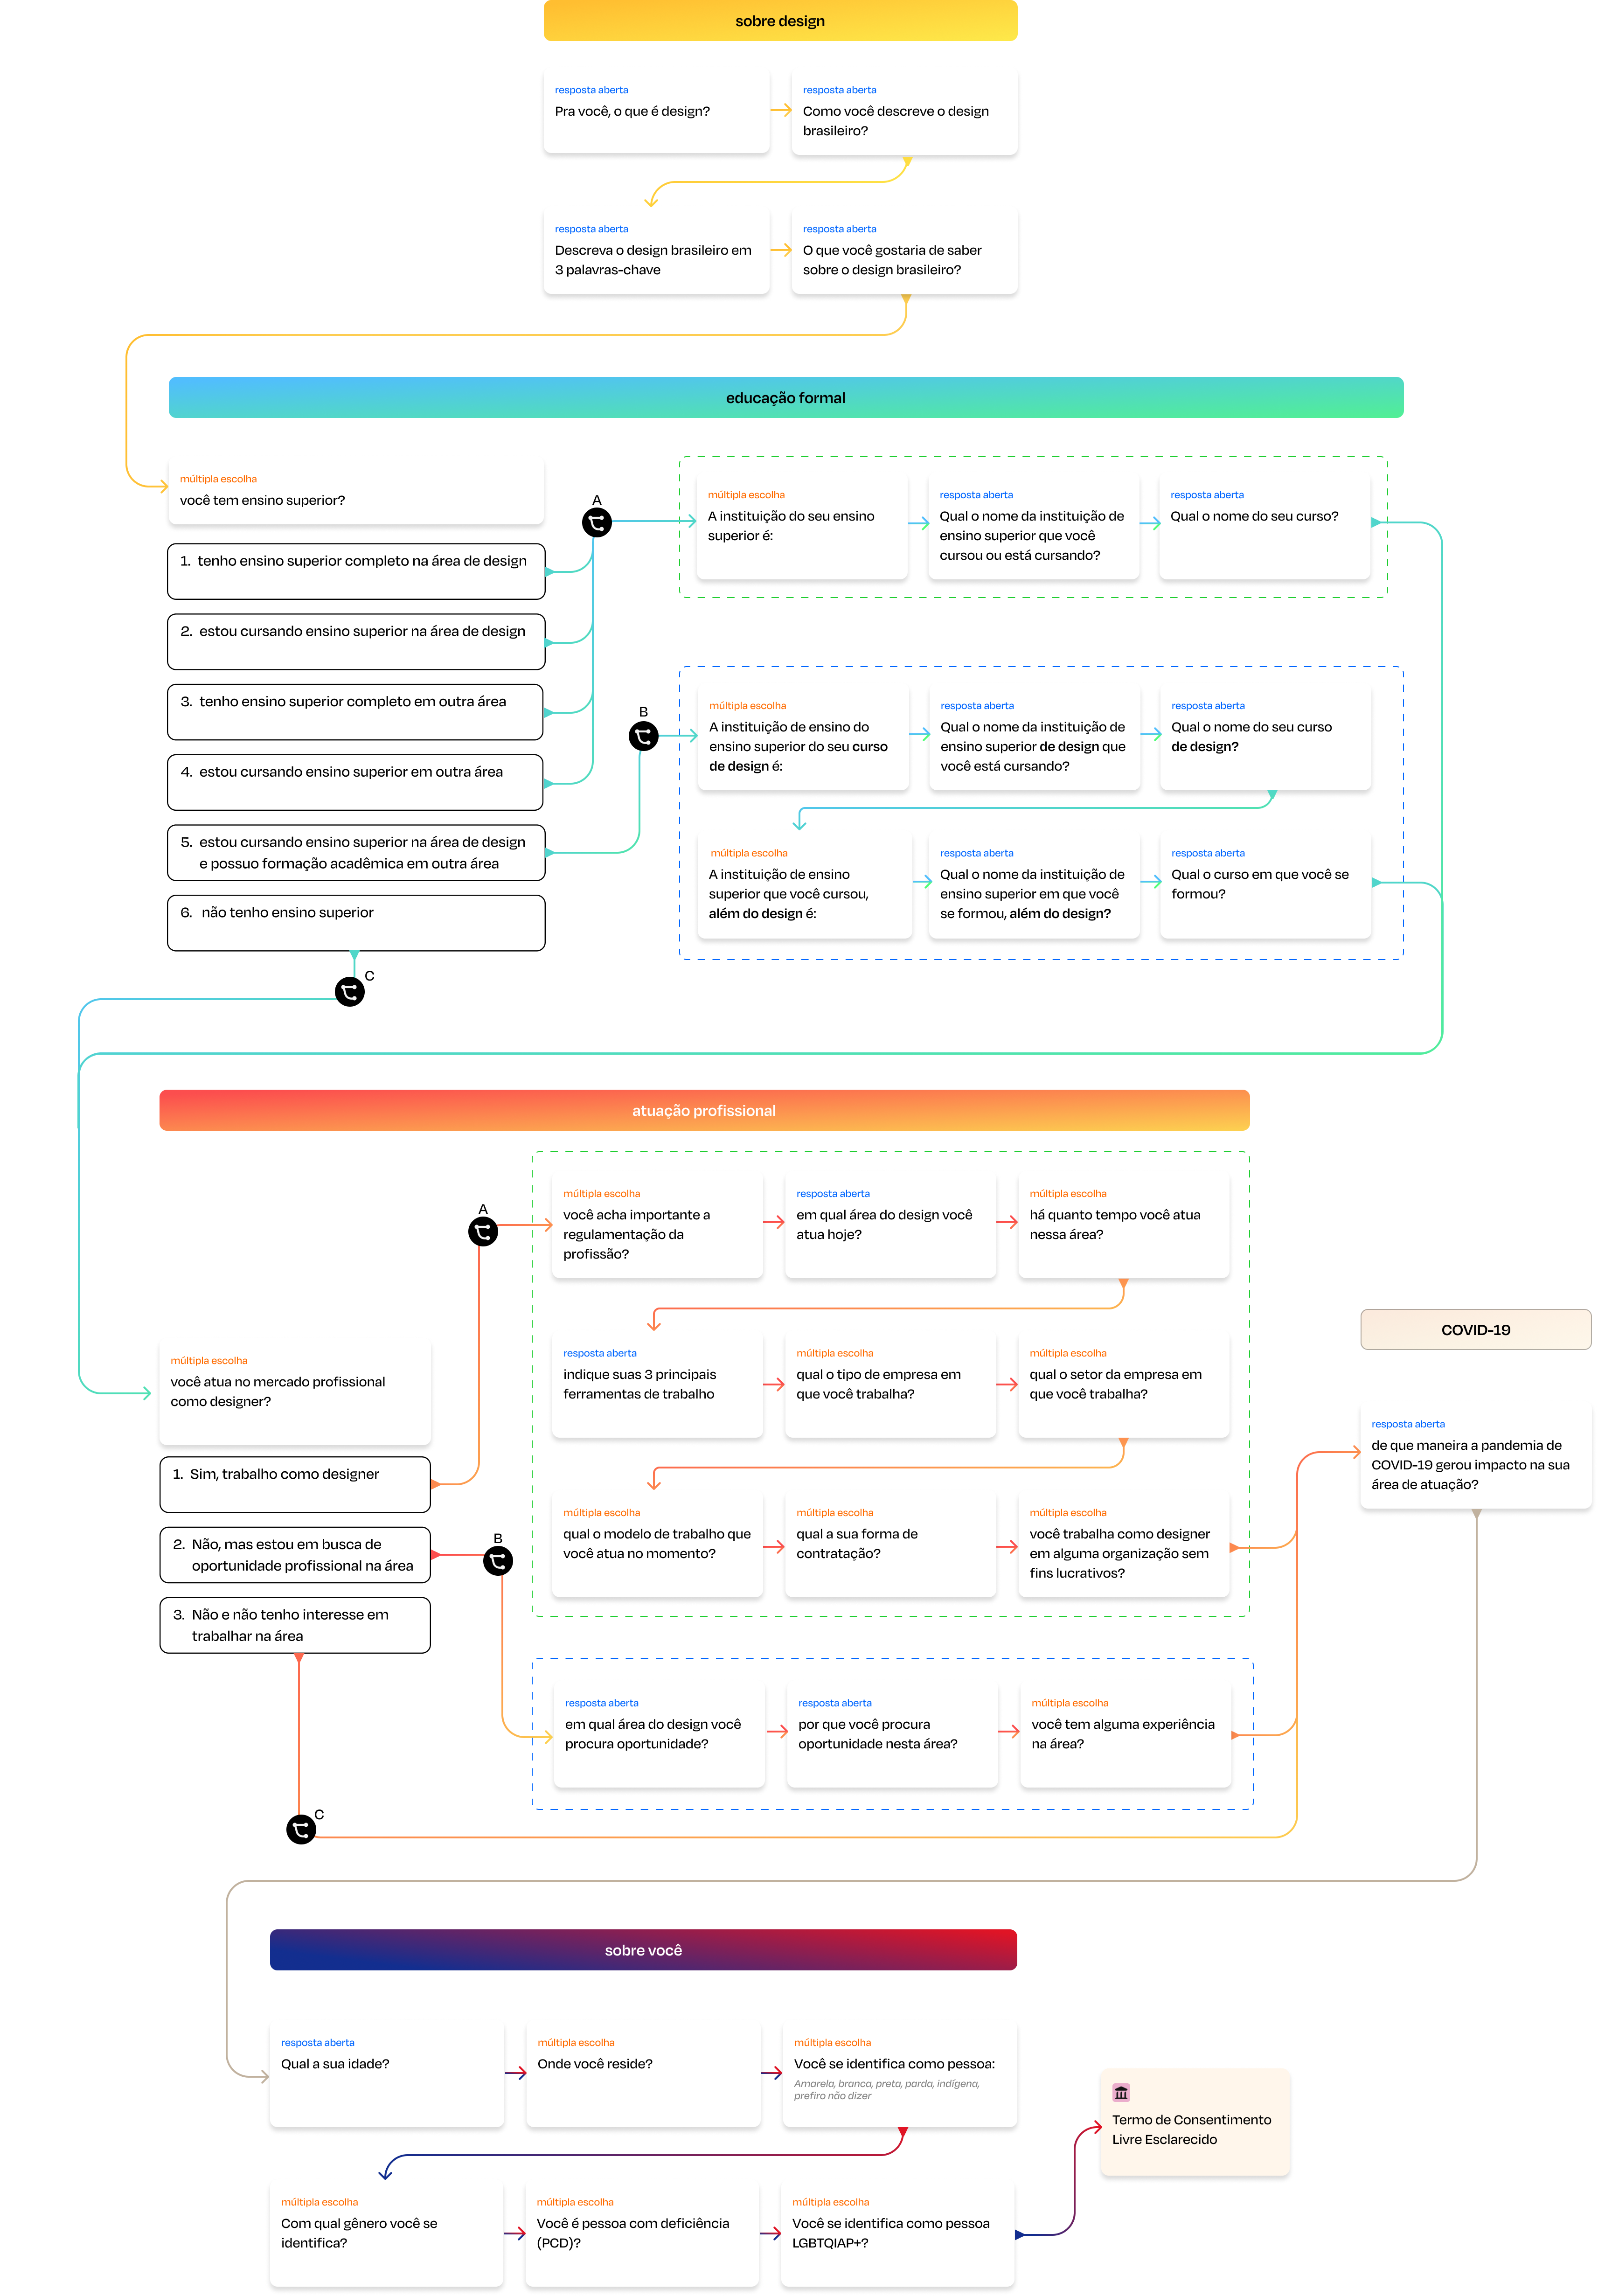
Online Survey Flow Diagram
The combined efforts of desk research, web scraping and online survey resulted in over 5,500 lines of structured and unstructured data collected.
Part of data collected in the project
Findings
406
Participants in survey
406 Individuals participated in the conducted survey aiming to understand who are and the people who recognize themselves as brazilian designers
114
Public Universities Investigated
Within the scope of Brazilian Public Universities, a desk research was conducted on all 114 institutions, individually looking for the criteria of having or not design-related courses
5K+
Articles collected
Through web scapping, over 5,000 articles were gathered from Blucher Proceedings in an attempt to understand trends in brazilian design knowledge generation
Explorations
After the data collection phase, a process of compiling and processing the information began, including the search for tools to automate these steps. Simultaneously, the best approaches for handling various data complexities were analyzed to ensure standardization of data formats.
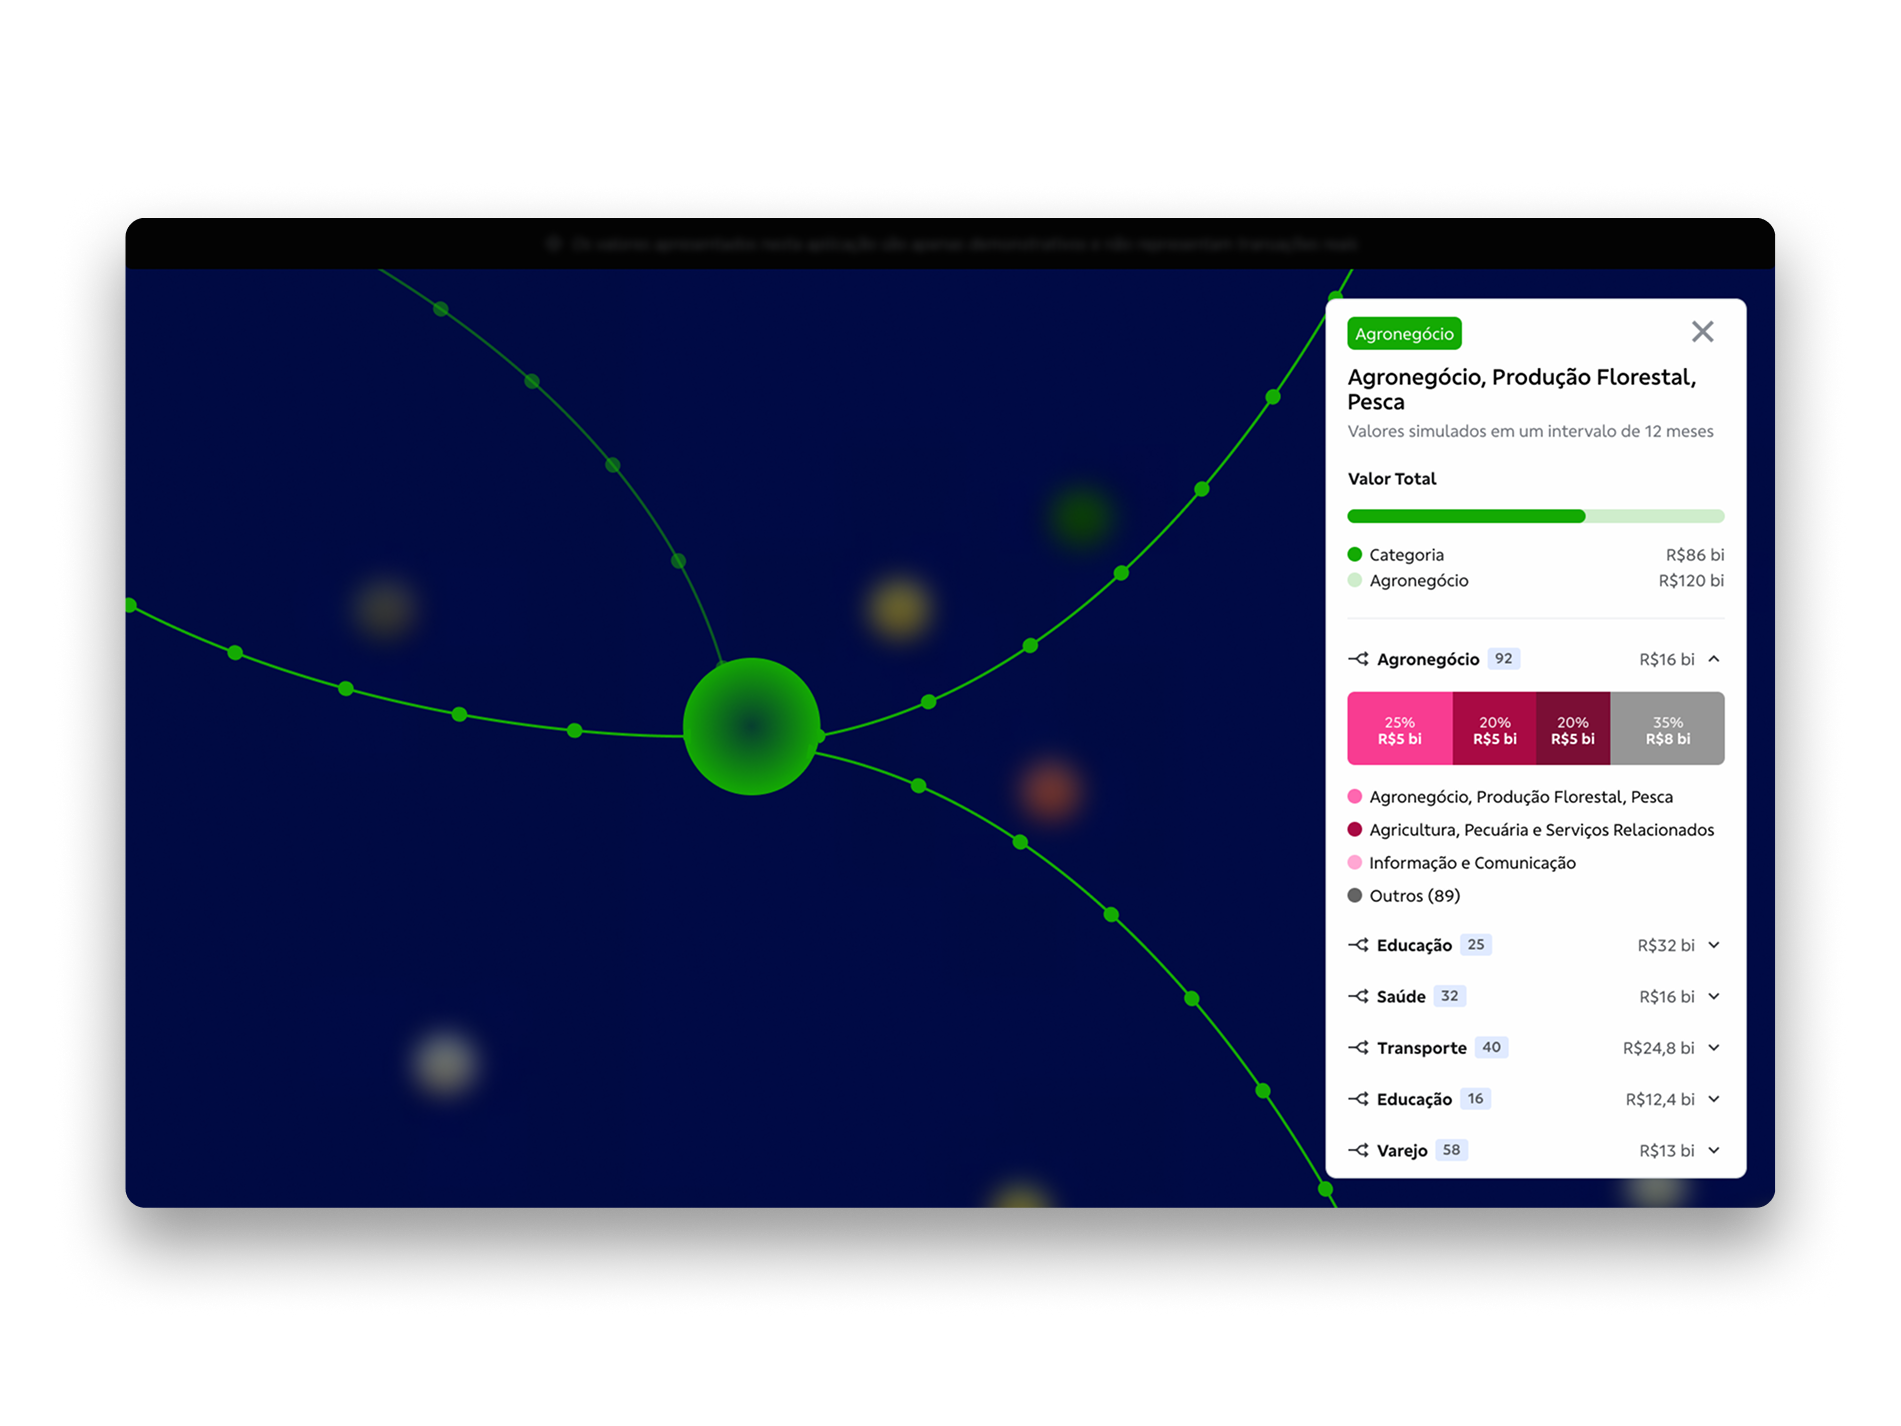
As part of the automation strategy, the data was migrated from spreadsheets to the MixPanel platform. Events and properties were customized to reflect the specific demands of the project, facilitating collaborative analysis and actionable insights.
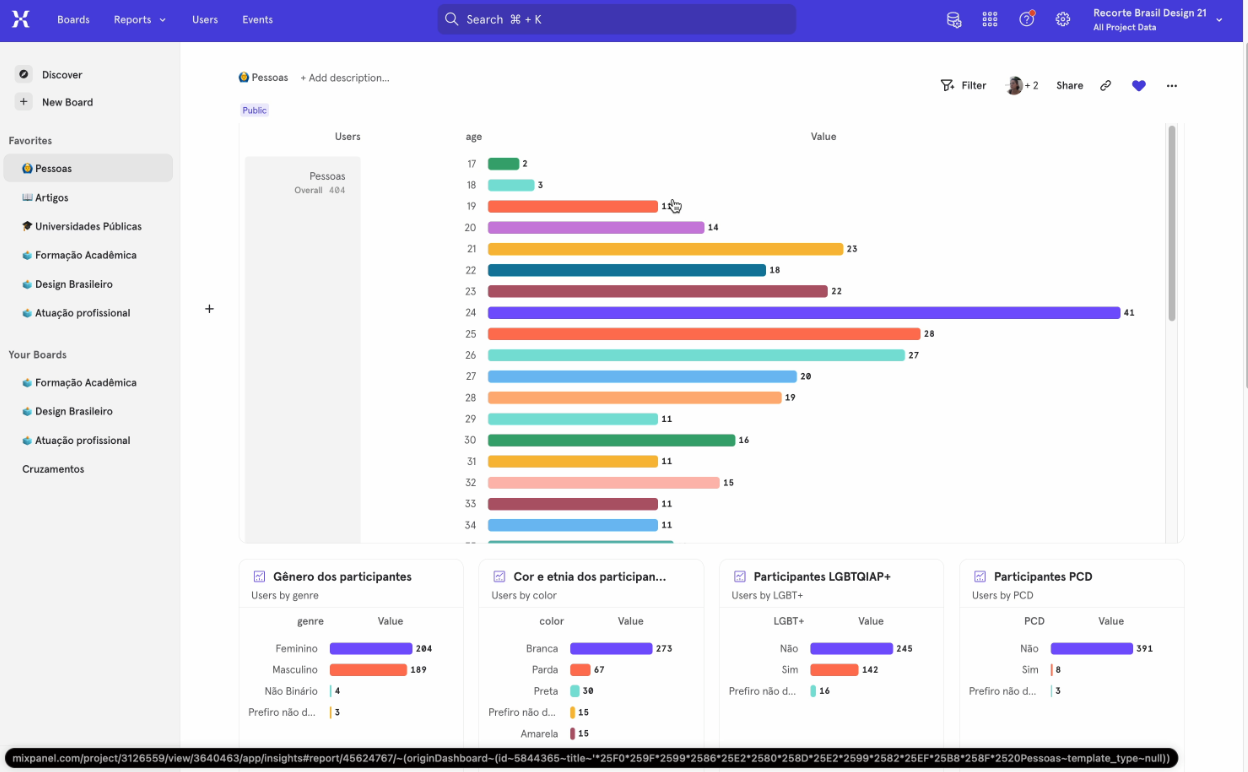
Data uploaded into MixPanel for Dashboard visualization
Creating the visual identity was also a crucial part of the journey, willing to capture Brazil's diversity while making the project easy to recognize. The goal was to create a consistent look across all communications and branding, establishing a sense of authority and showing the project as something serious yet exciting.
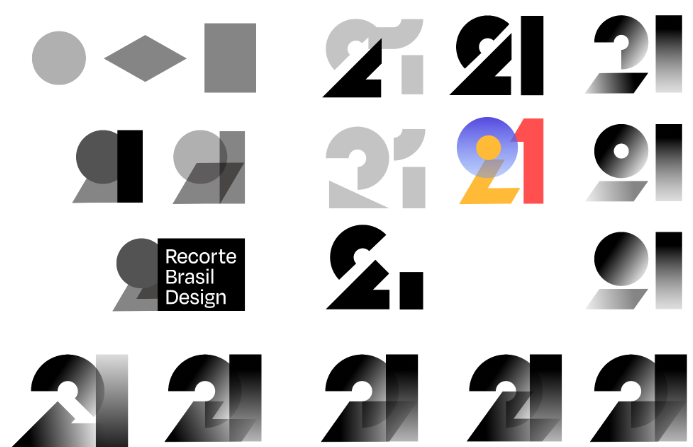
Refinement resume of the visual identity crafting
Outcome
Over three years of work, from 2021 to 2023, the process was long and challenging, but was strengthened by the support of those who believed the vision and purpose behind it. The outcome was a bold project that showcased the importance of generating data to foster meaningful discussions and inspire action where change is needed.
Results
30+
Data visualization charts
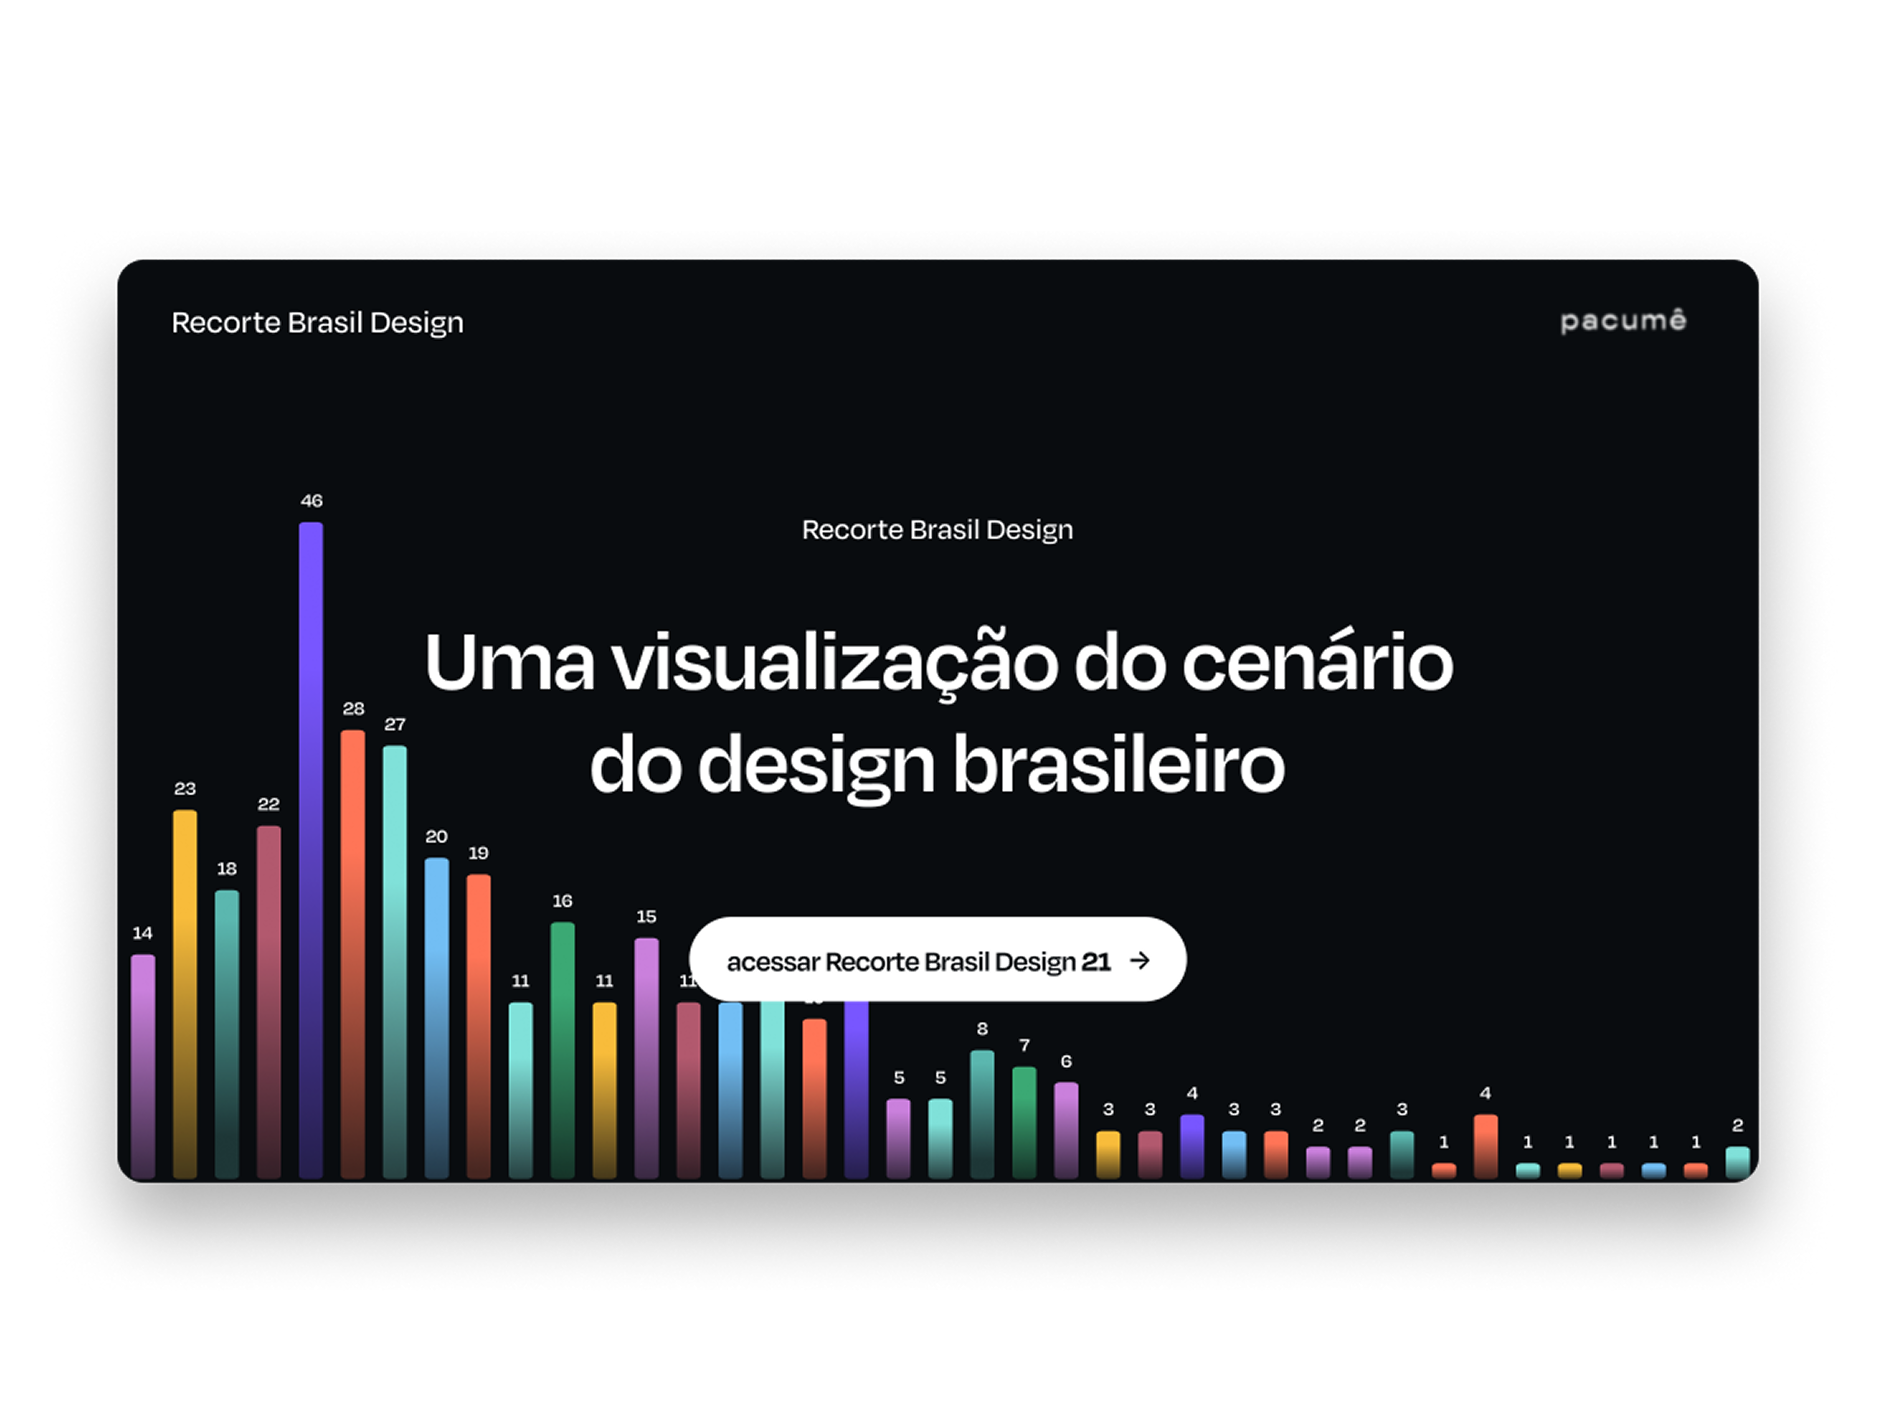
Over 5,000 lines of data were summarized and translated into 31 data visualization diagrams, organized by major themes of interest. This approach simplifies the understanding and facilitates the extraction of insights and discussions about brazilian design.
Free, responsive website
The insights and findings of the project were made freely available on a responsive website to ensure that the goal of having widespread access to the data and easy sharing was met. This way, it could be opened by anyone, anywhere.
Strong, collaborative results
This project came to life thanks to the collaboration of many people: those who helped develop tools to curate data, key contacts who helped spread the word and provided brand support, and everyone who participated in and shared the survey. Their involvement was very significative to the project and reflects the rich and interconnected nature of an identity shaped by many.

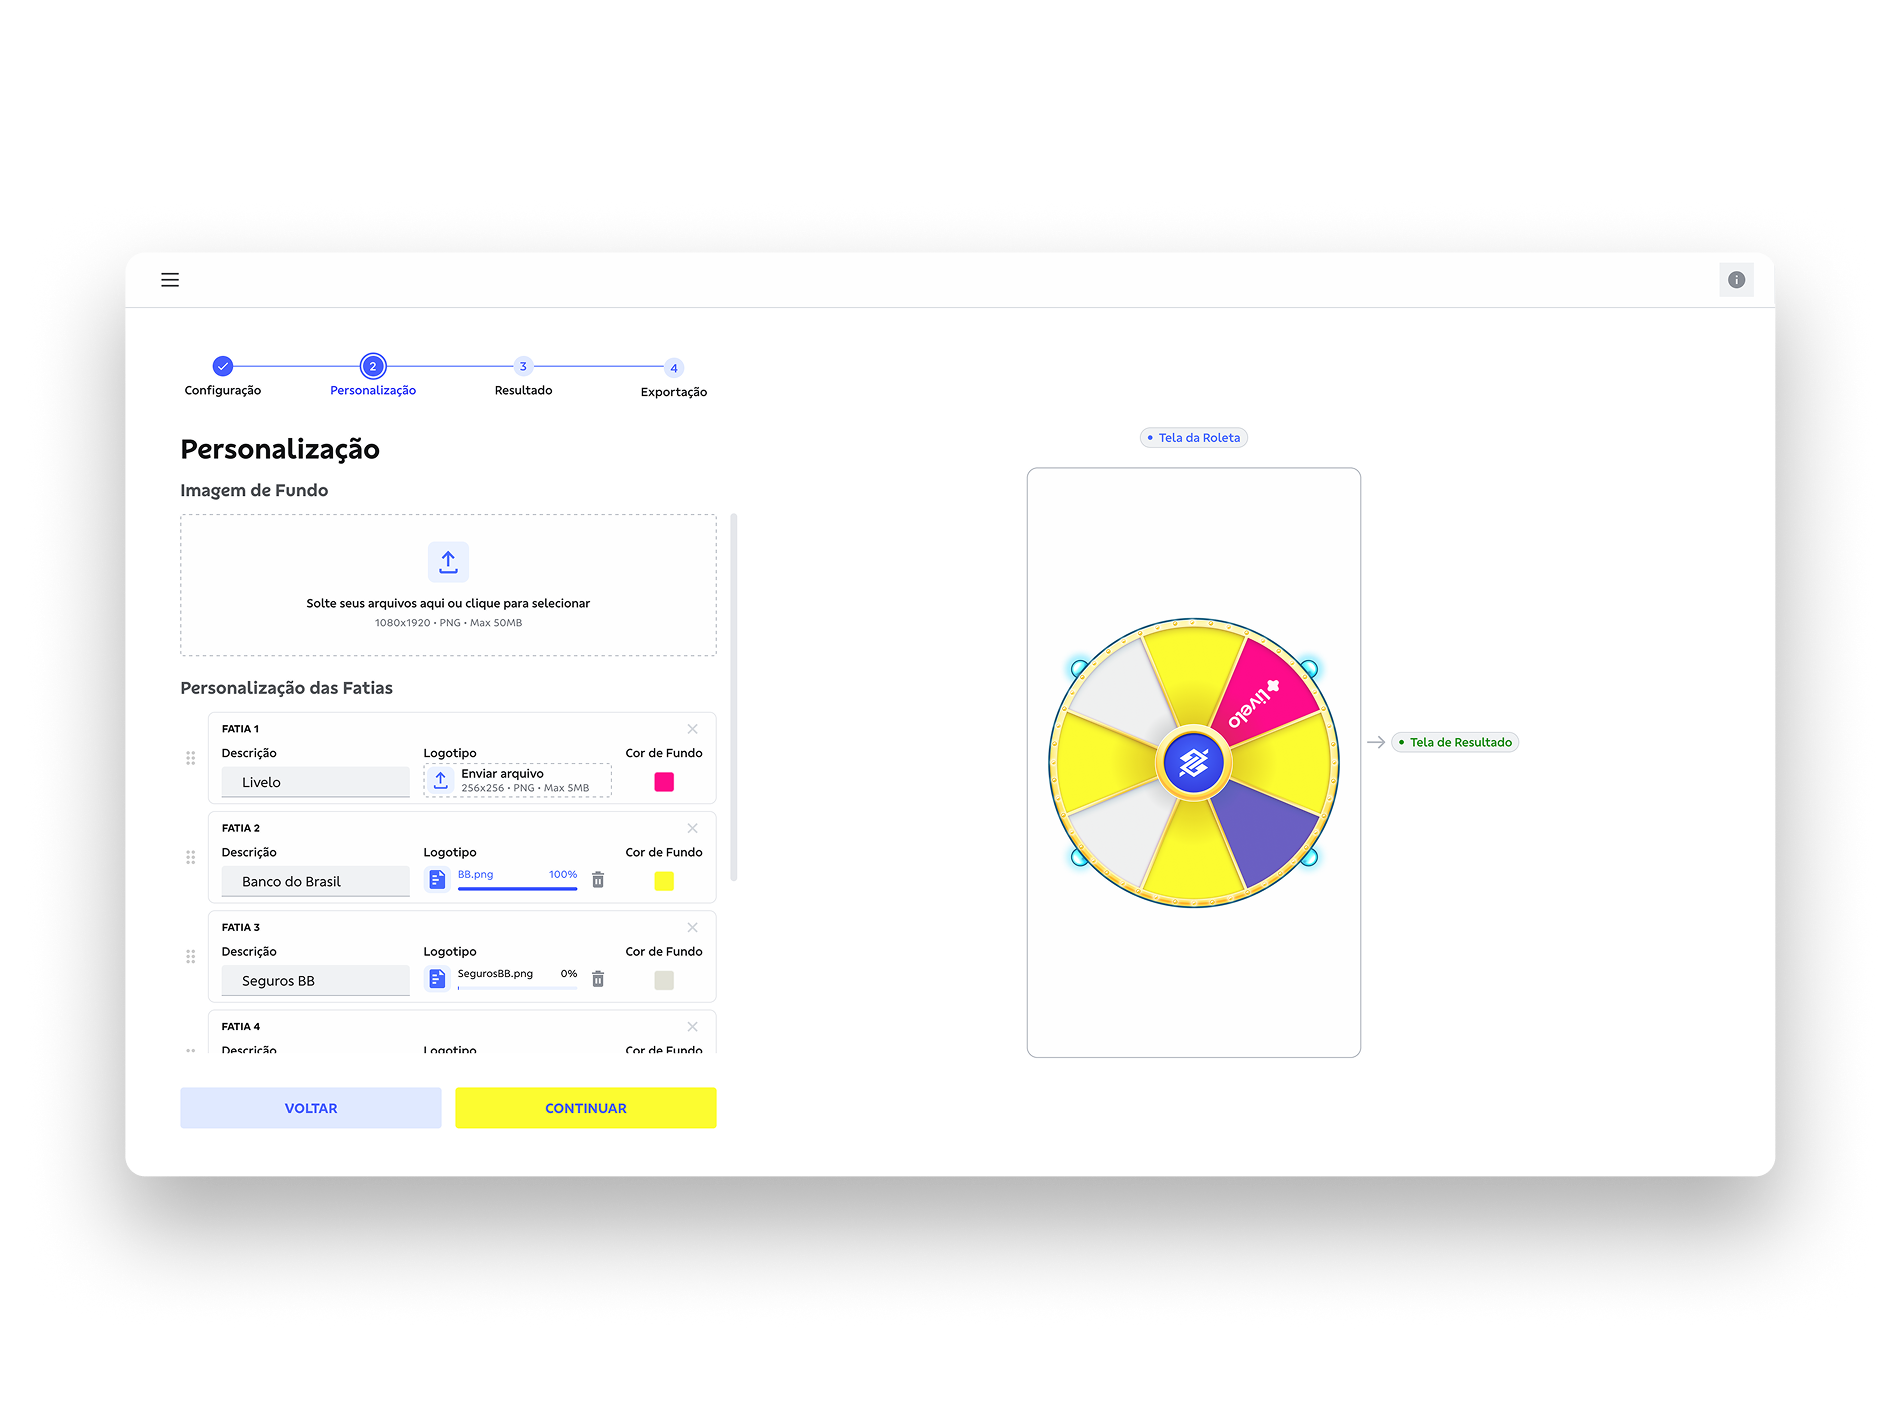
Wanna interact with the project? 👀
Here is the prototype for you to explore ↓ (brazilian-pt only)