Ana / Value Chain
Reshaping Data Visualization for Economic Activities
This project aims to showcase innovation and was born from the need to capture the audience's attention and make the tracking of economic activity relationships accessible to broader audiences. Using complex data, extracted from CNAE (National Classification of Economic Activities) open source database, the challenge was to simplify and present it in an intuitive and acessible way.
How can we translate complex data into accessible, concise information?
Goals
Redesign the experience
The original data dashboard was confusing and demanded more steps than necessary to achieve a desired outcome, making the overall experience draining and laborious
Organize the data
The original dashboard for the economic's value chain was complex, disconnected and had a messy display of information
Enchant the audience
Banco do Brasil invests in technology and innovation and continuously demonstrates its commitment to digital transformation and technological development. It is important to bring these innovative solutions to the eyes of the public and make it accessible for everyone.
Visual tools to understand a complex world
Economic dynamics are a complex phenomenon, but visual resources can be a powerful tool to make them tangible and interpretative.
Audit and Insights
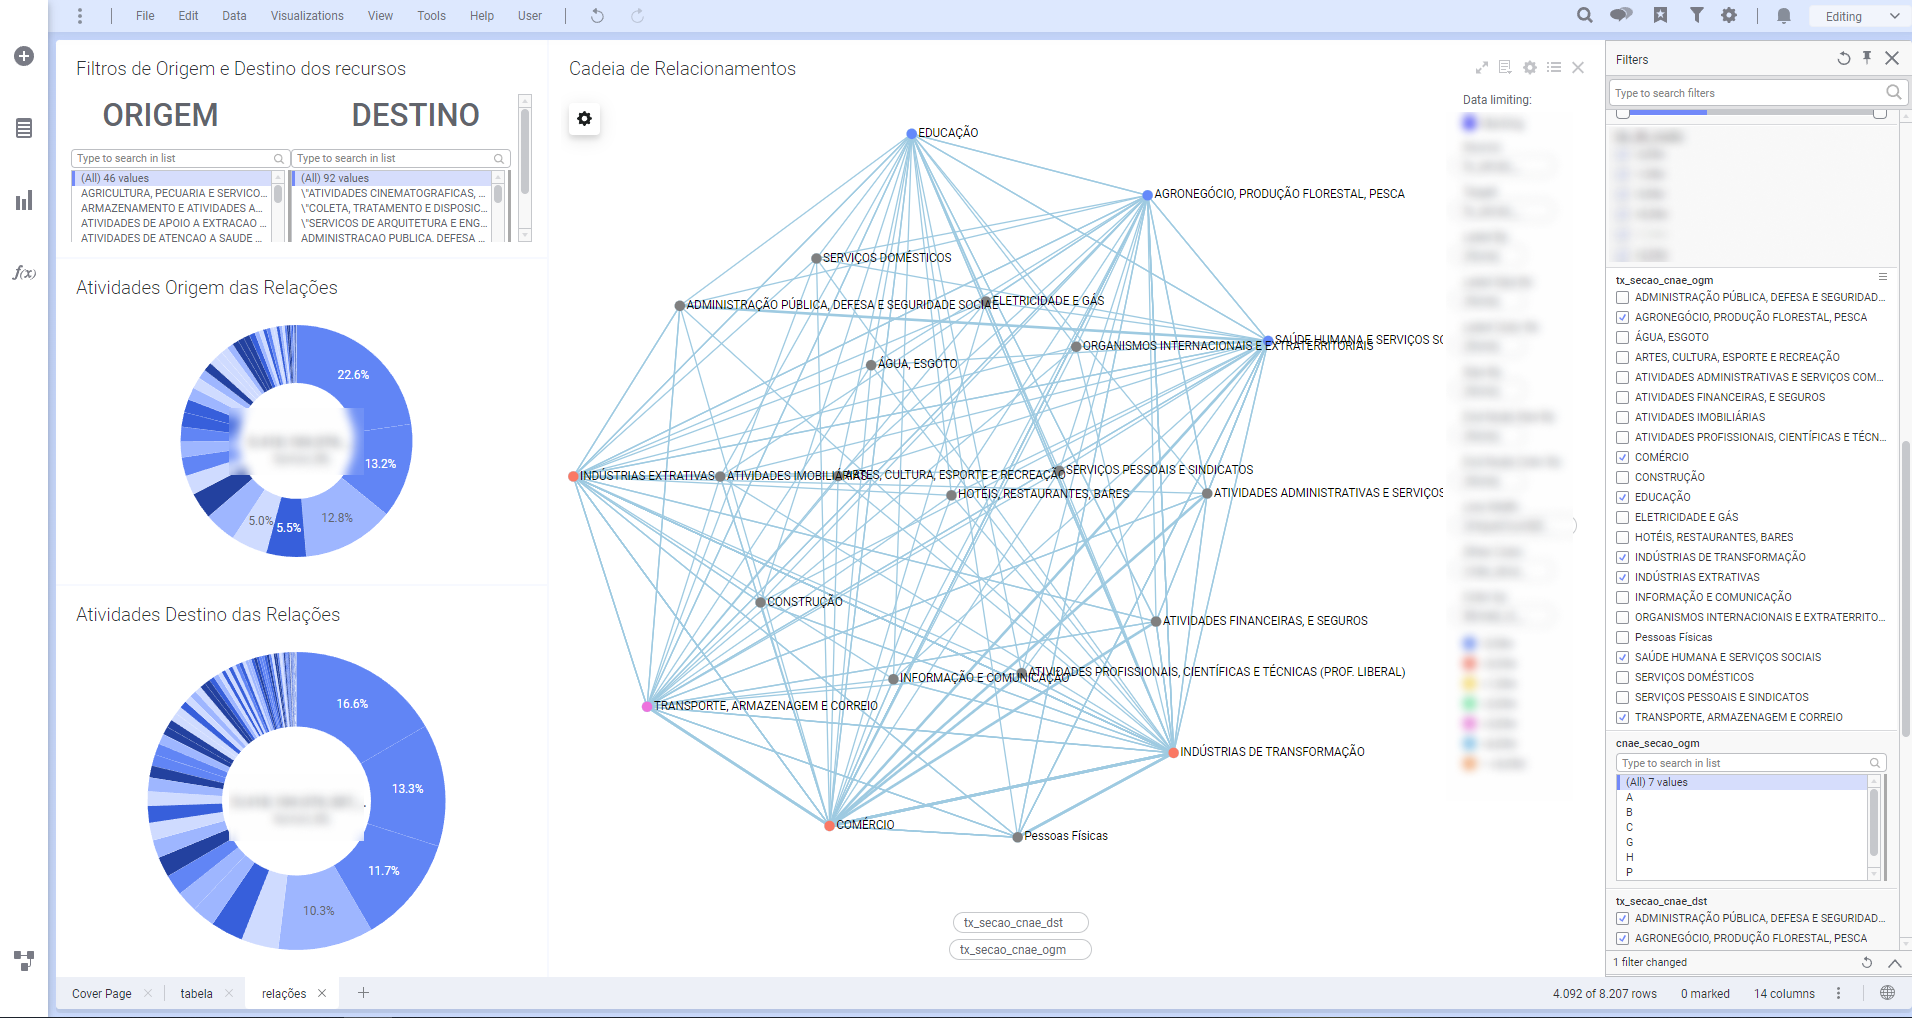
Old dashboard showing connections and transactions between CNAE nodes
The viewer was characterized by a complex interface and a cluttered design, making it challenging to navigate and understand what was going on at each viewer section.
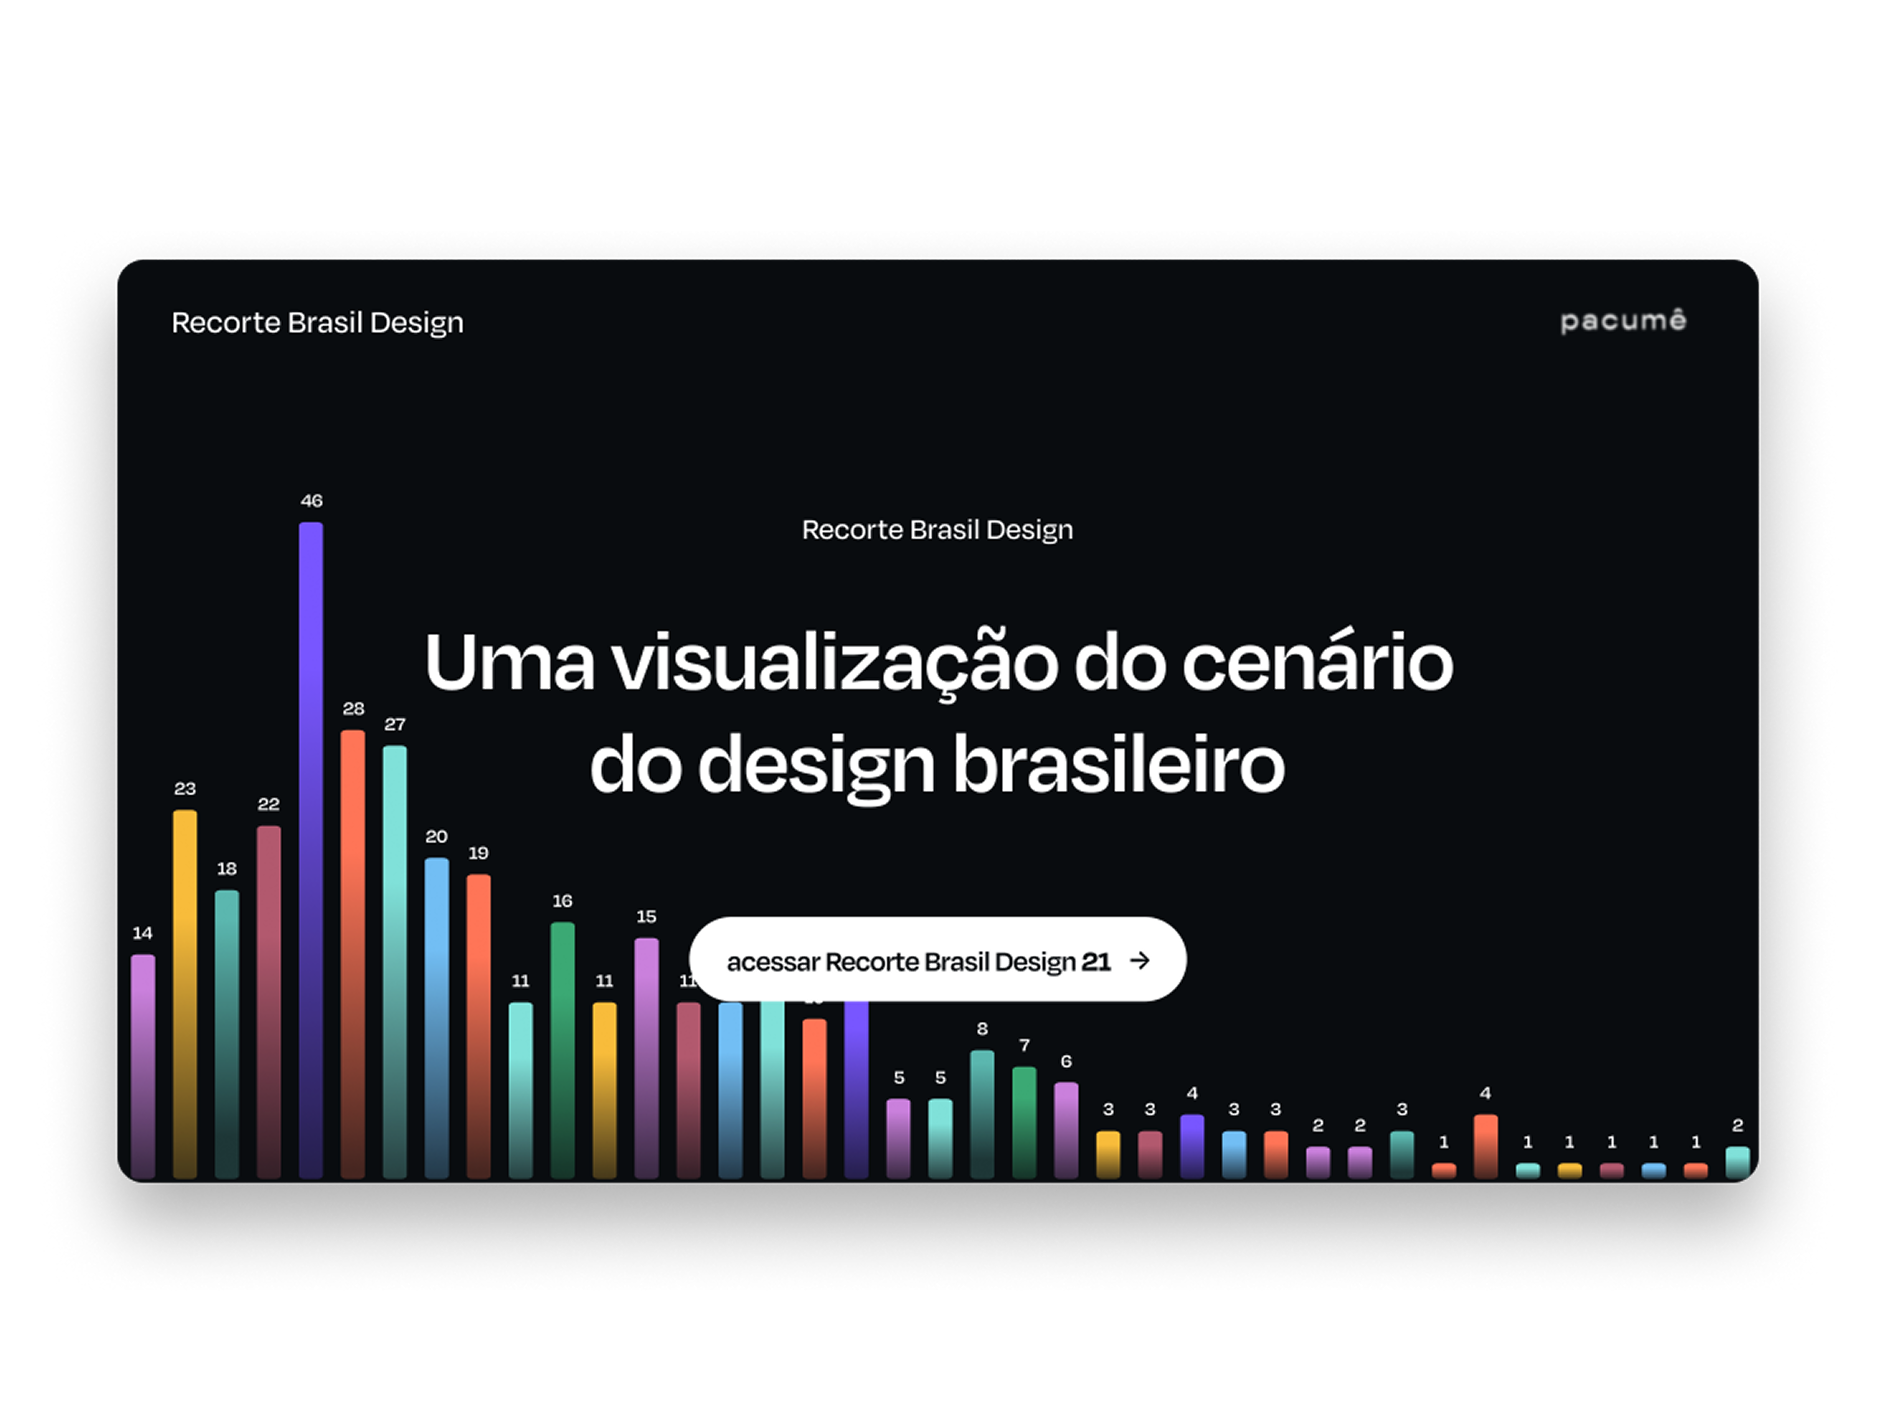
Overview of the delimited table of contents for the project
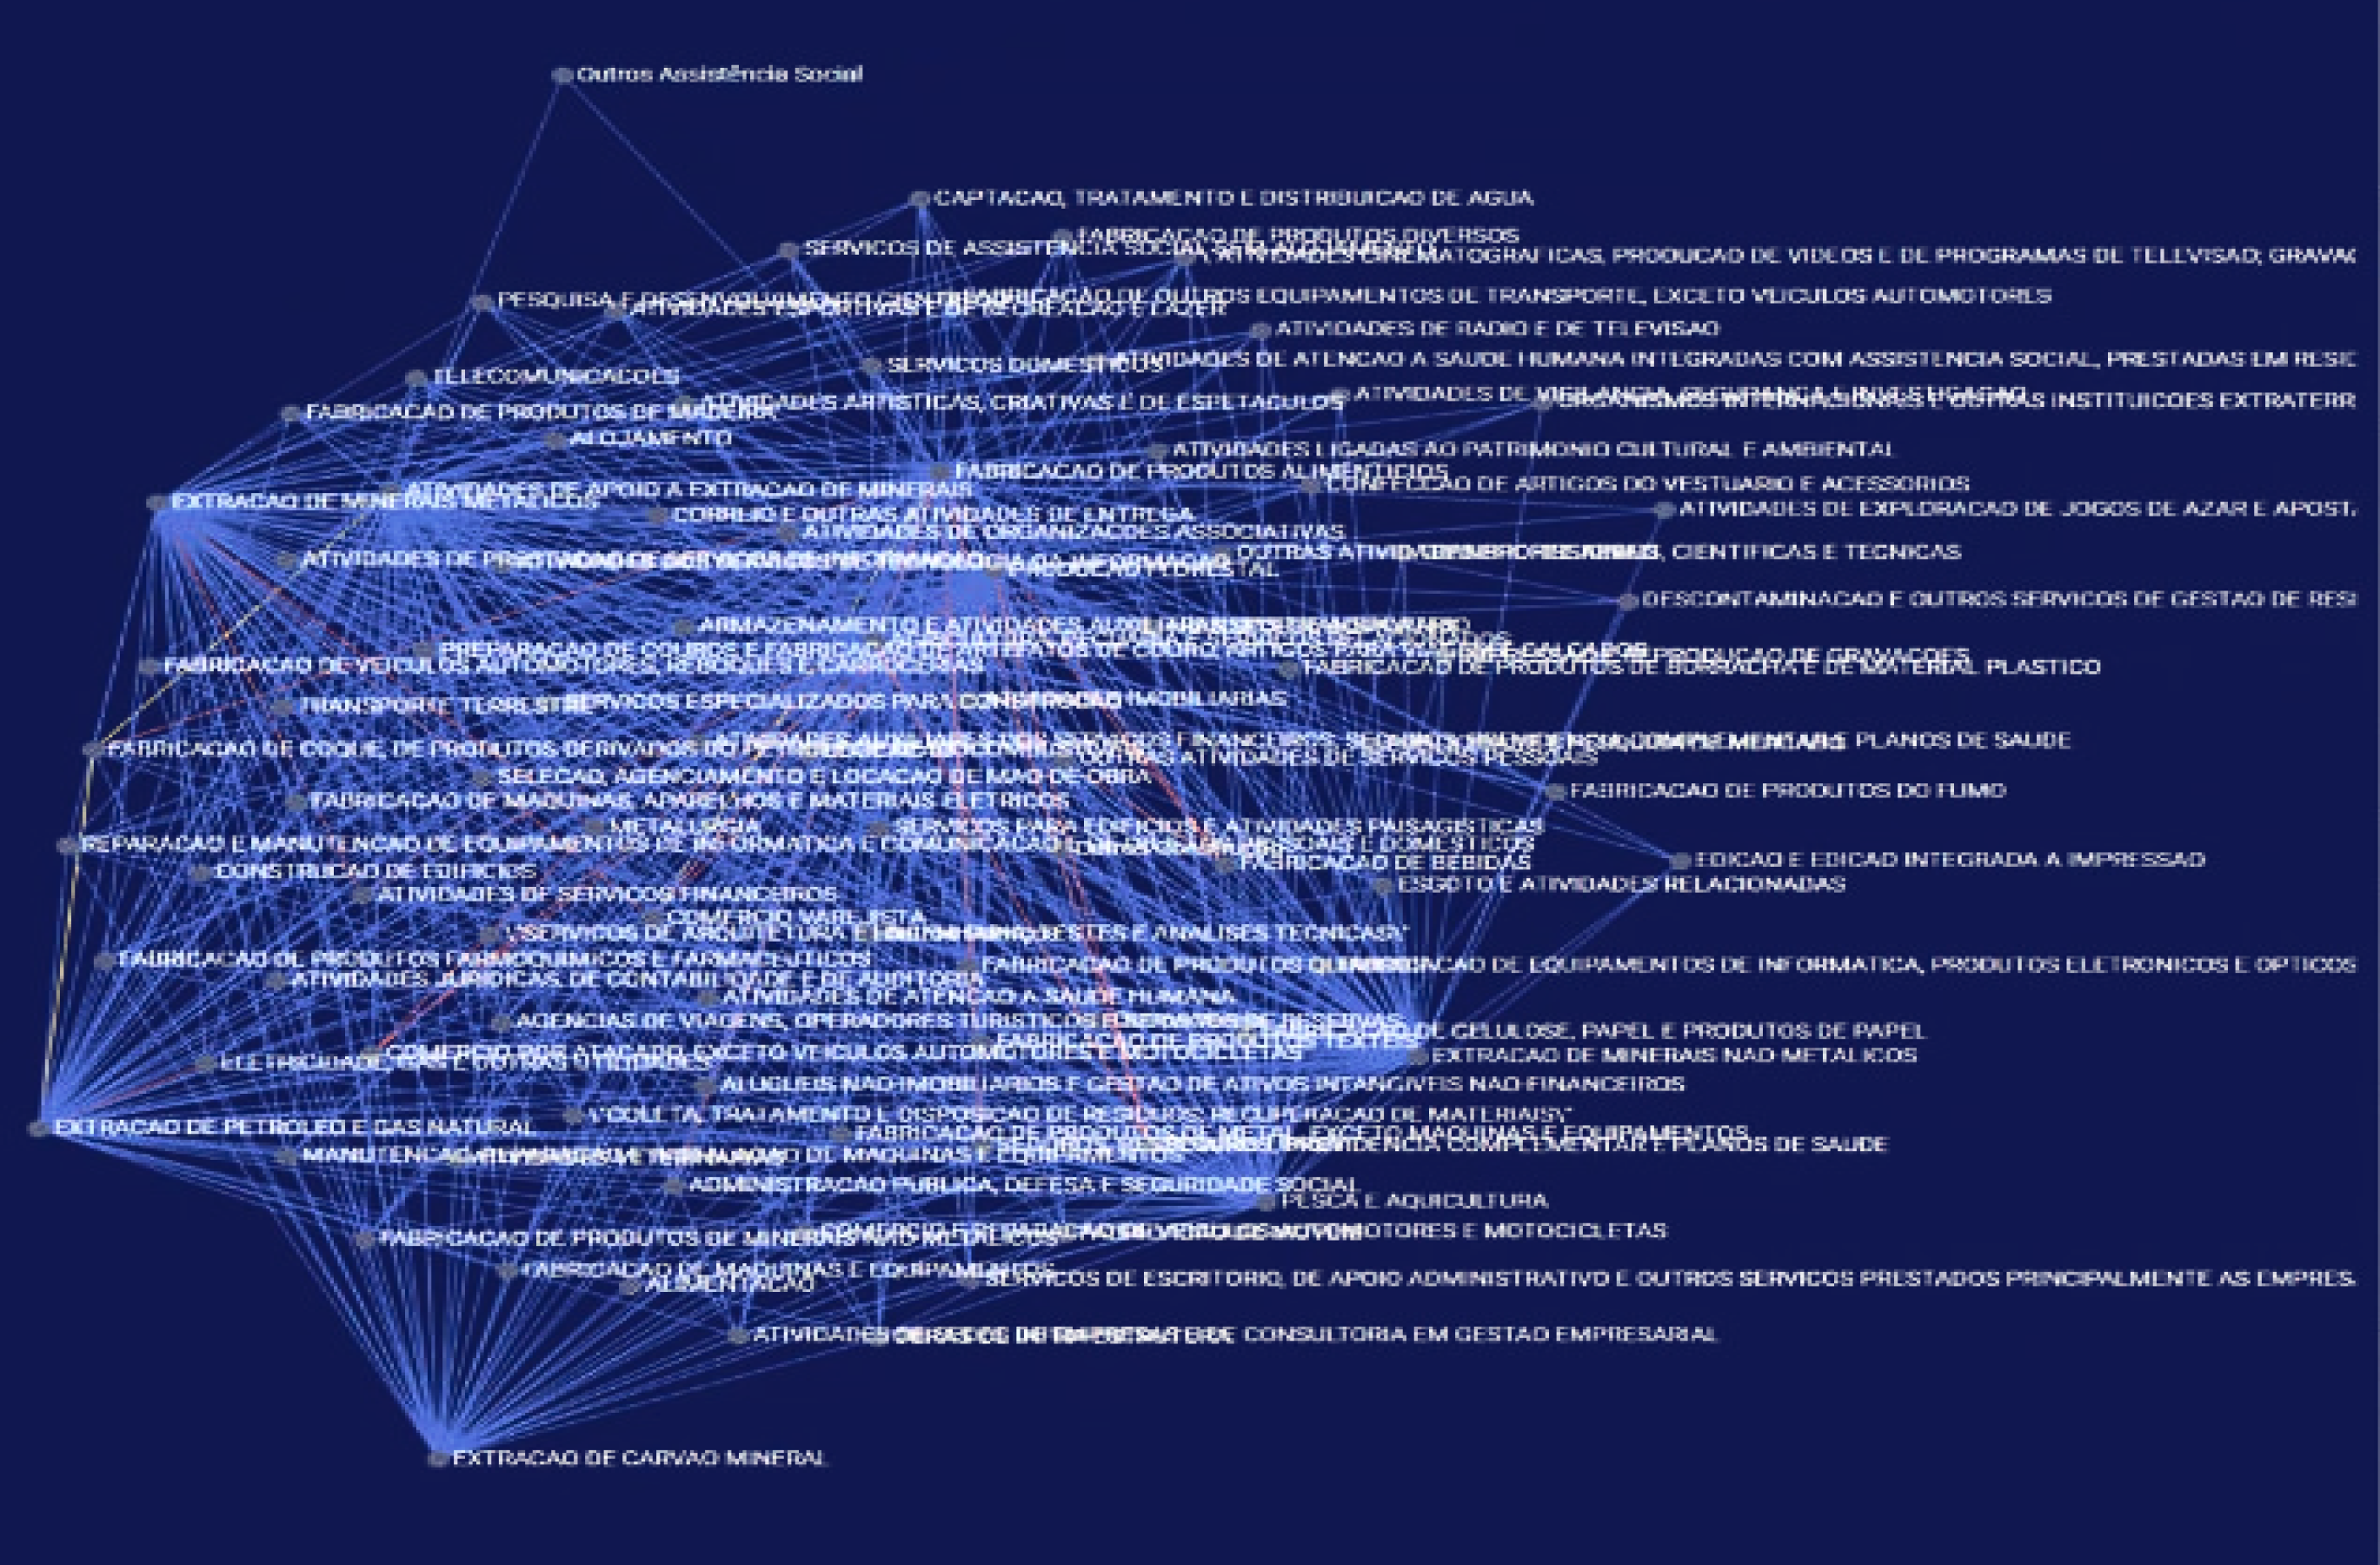
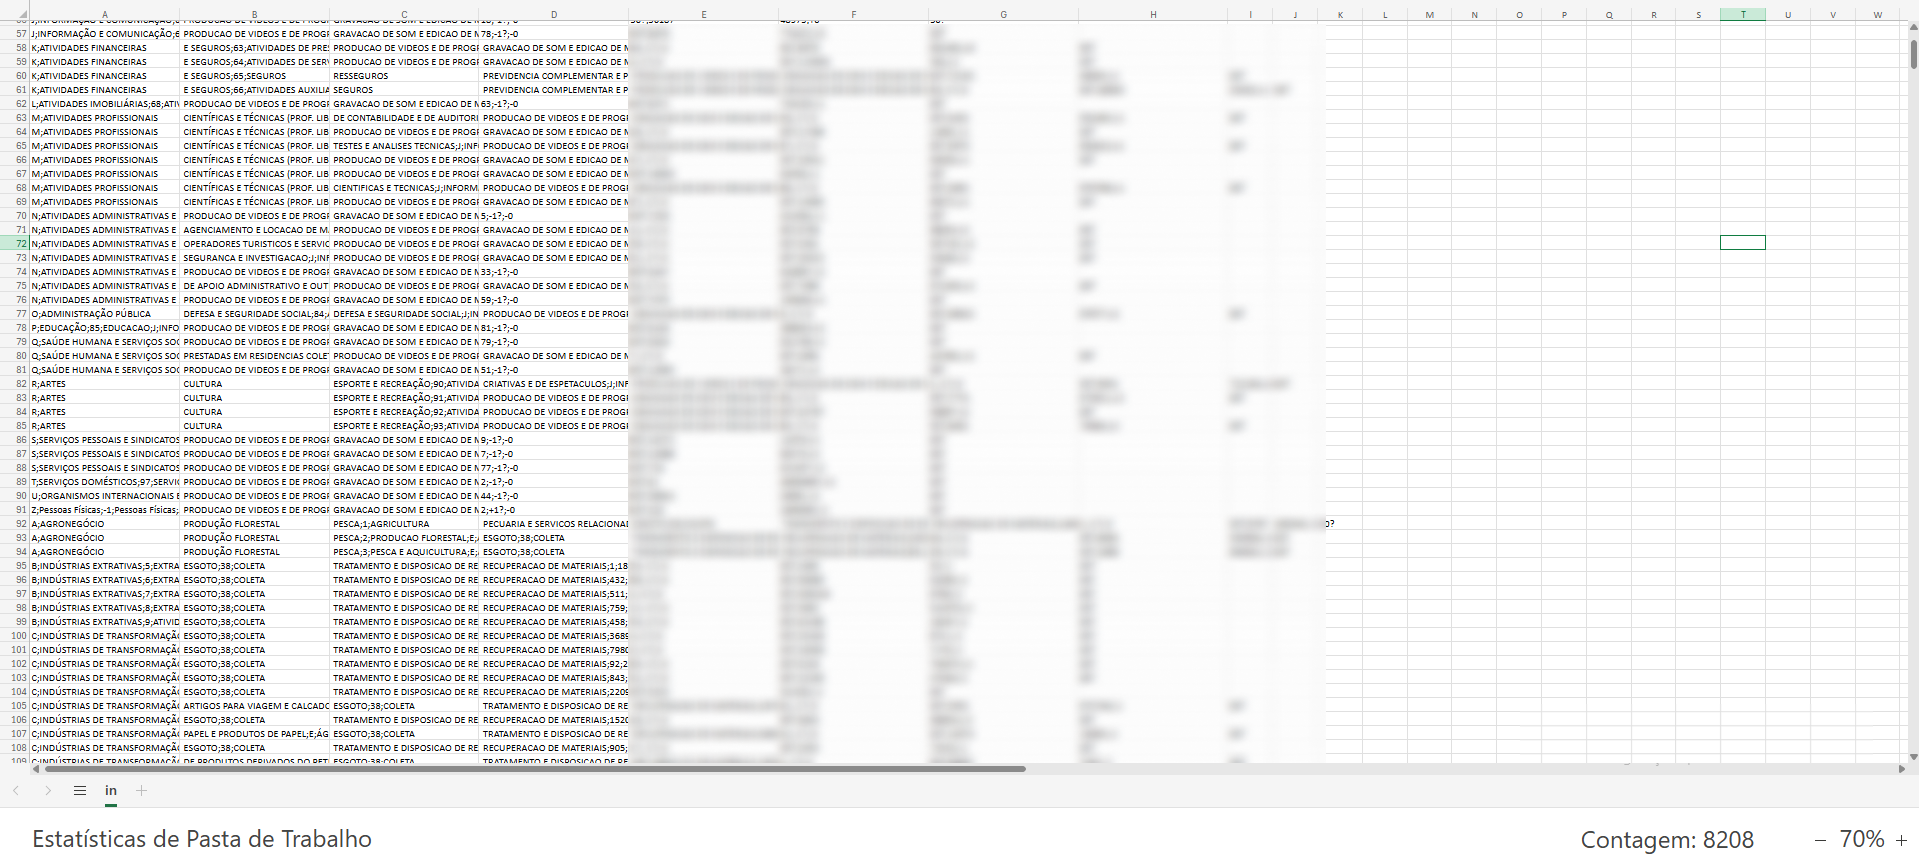
Initial Visualization of Node Connections Without Data Processing
By exploring the issue, understanding the data, designing the tool and acting on public engagement, the goal was to rethink the experience completely.
Design Strategy
Make it simpler, make it visual
Visual tools play a great role on making complex phenomenon visible, accessible, understandable and usable. For a data experience project, it is important to explore ways to visualize information.
Make people see the data
Identify patterns, treat and organize the information, so people can pay more attention on understanding the story being told by the data and not on trying to figure out the interface.
Act on Public Engagement
As the project aims for broader audience, there is a need to engage people with the experience. Information design seeks to be interacted with, but in a conference context, it has to physically stand out and break the barrier of digital world to make the space part of the experience.
Explorations
As the solution works with real-time filtering to have a dynamic and immediate view of the relationships within and across economic sectors, the explorations were focused on empowering all users to effortlessly view, explore and interpretate these chains.
Prioritizing the graphic visualization aspect of the project, the Unity game engine was selected as the core development tool. This choice enabled the crafting of a real-time 3D graph system, providing dynamic interactions, visual effects, and complex animations without compromising performance, even with a significant and challenging volume of data. Understanding the technical process was critical in designing a solution that worked within the limitations of the game engine, leading to a process of adapting the design by simplifying or rethinking some of the initial explorations.
The refinement of the information to be shown was a challenge itself, as the data received was raw and unprocessed, making it difficult to understand how the elements connected and what was truly relevant for users to visualize. This process of understanding the data led to numerous iterations on the UI, looking for better ways to translate the complex information into an organized and readable format.
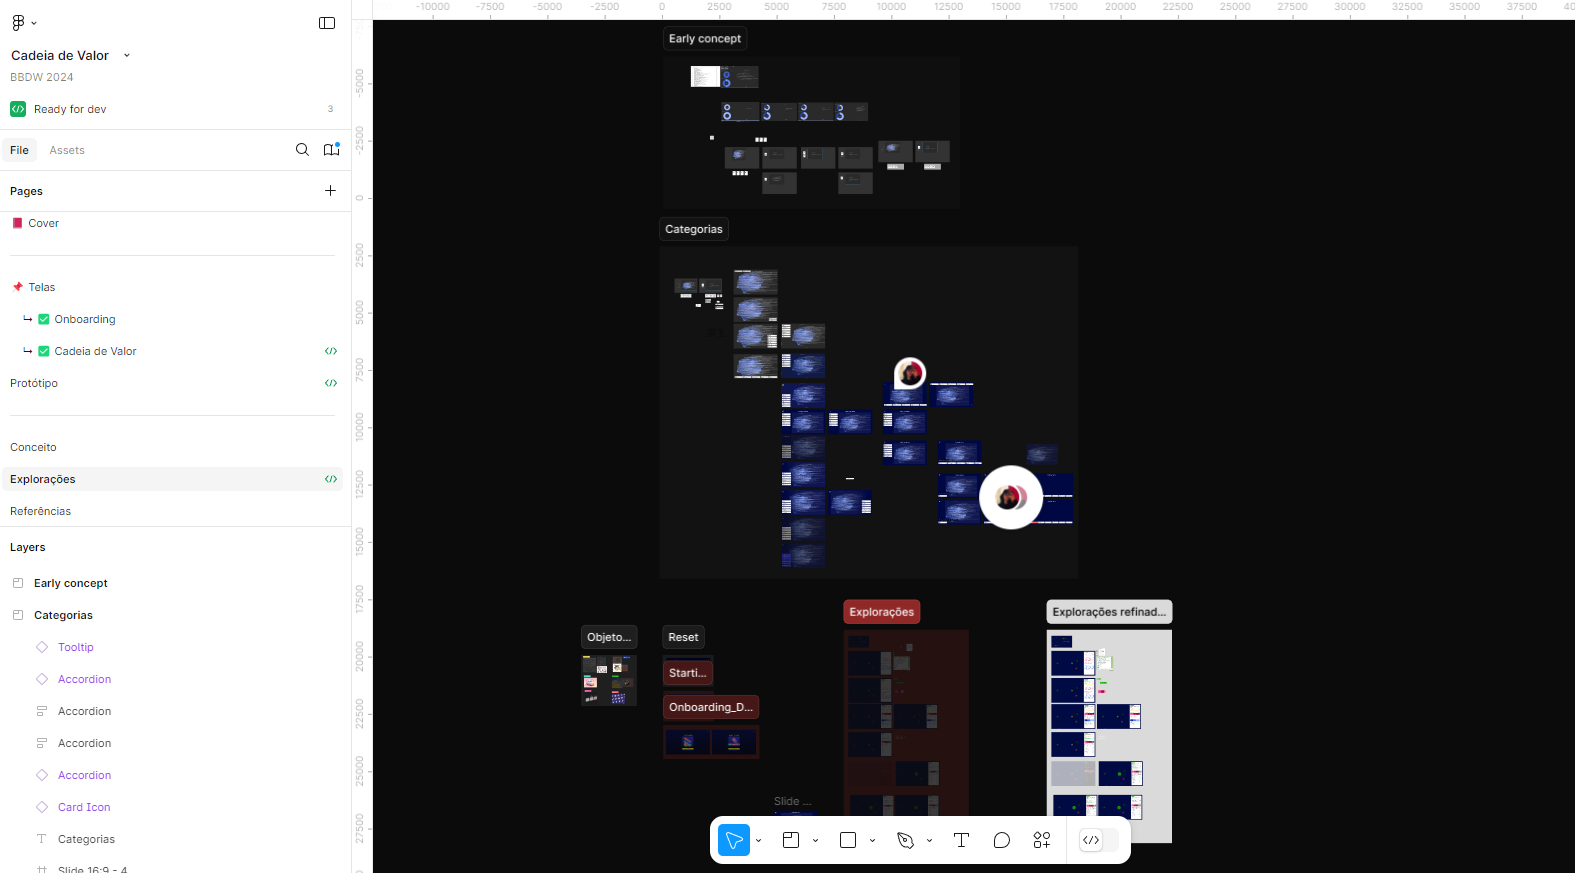
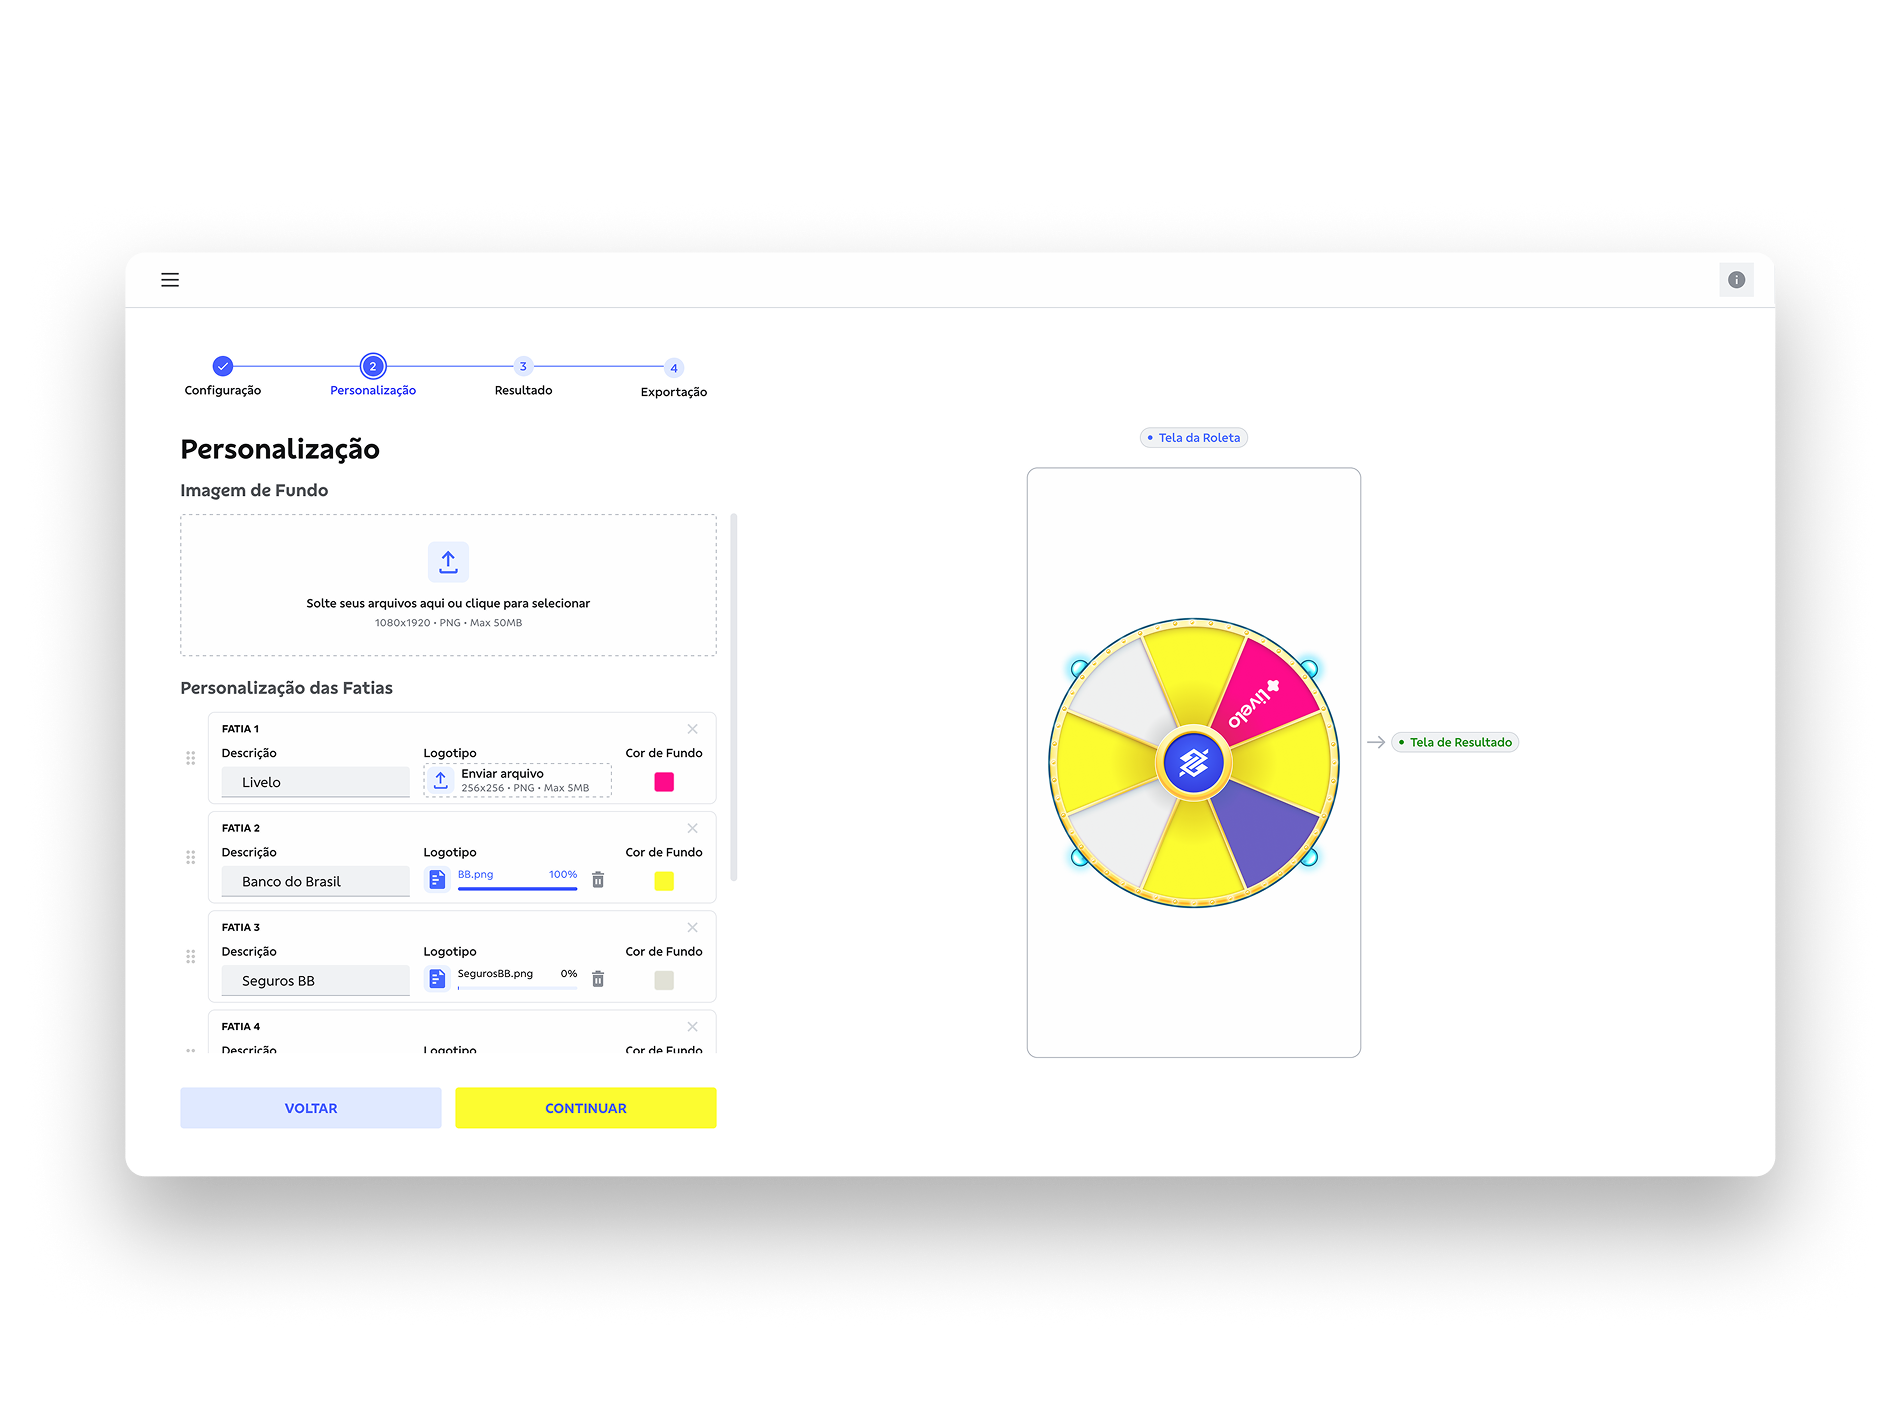
Overview of initial explorations for filtering and visualization of data
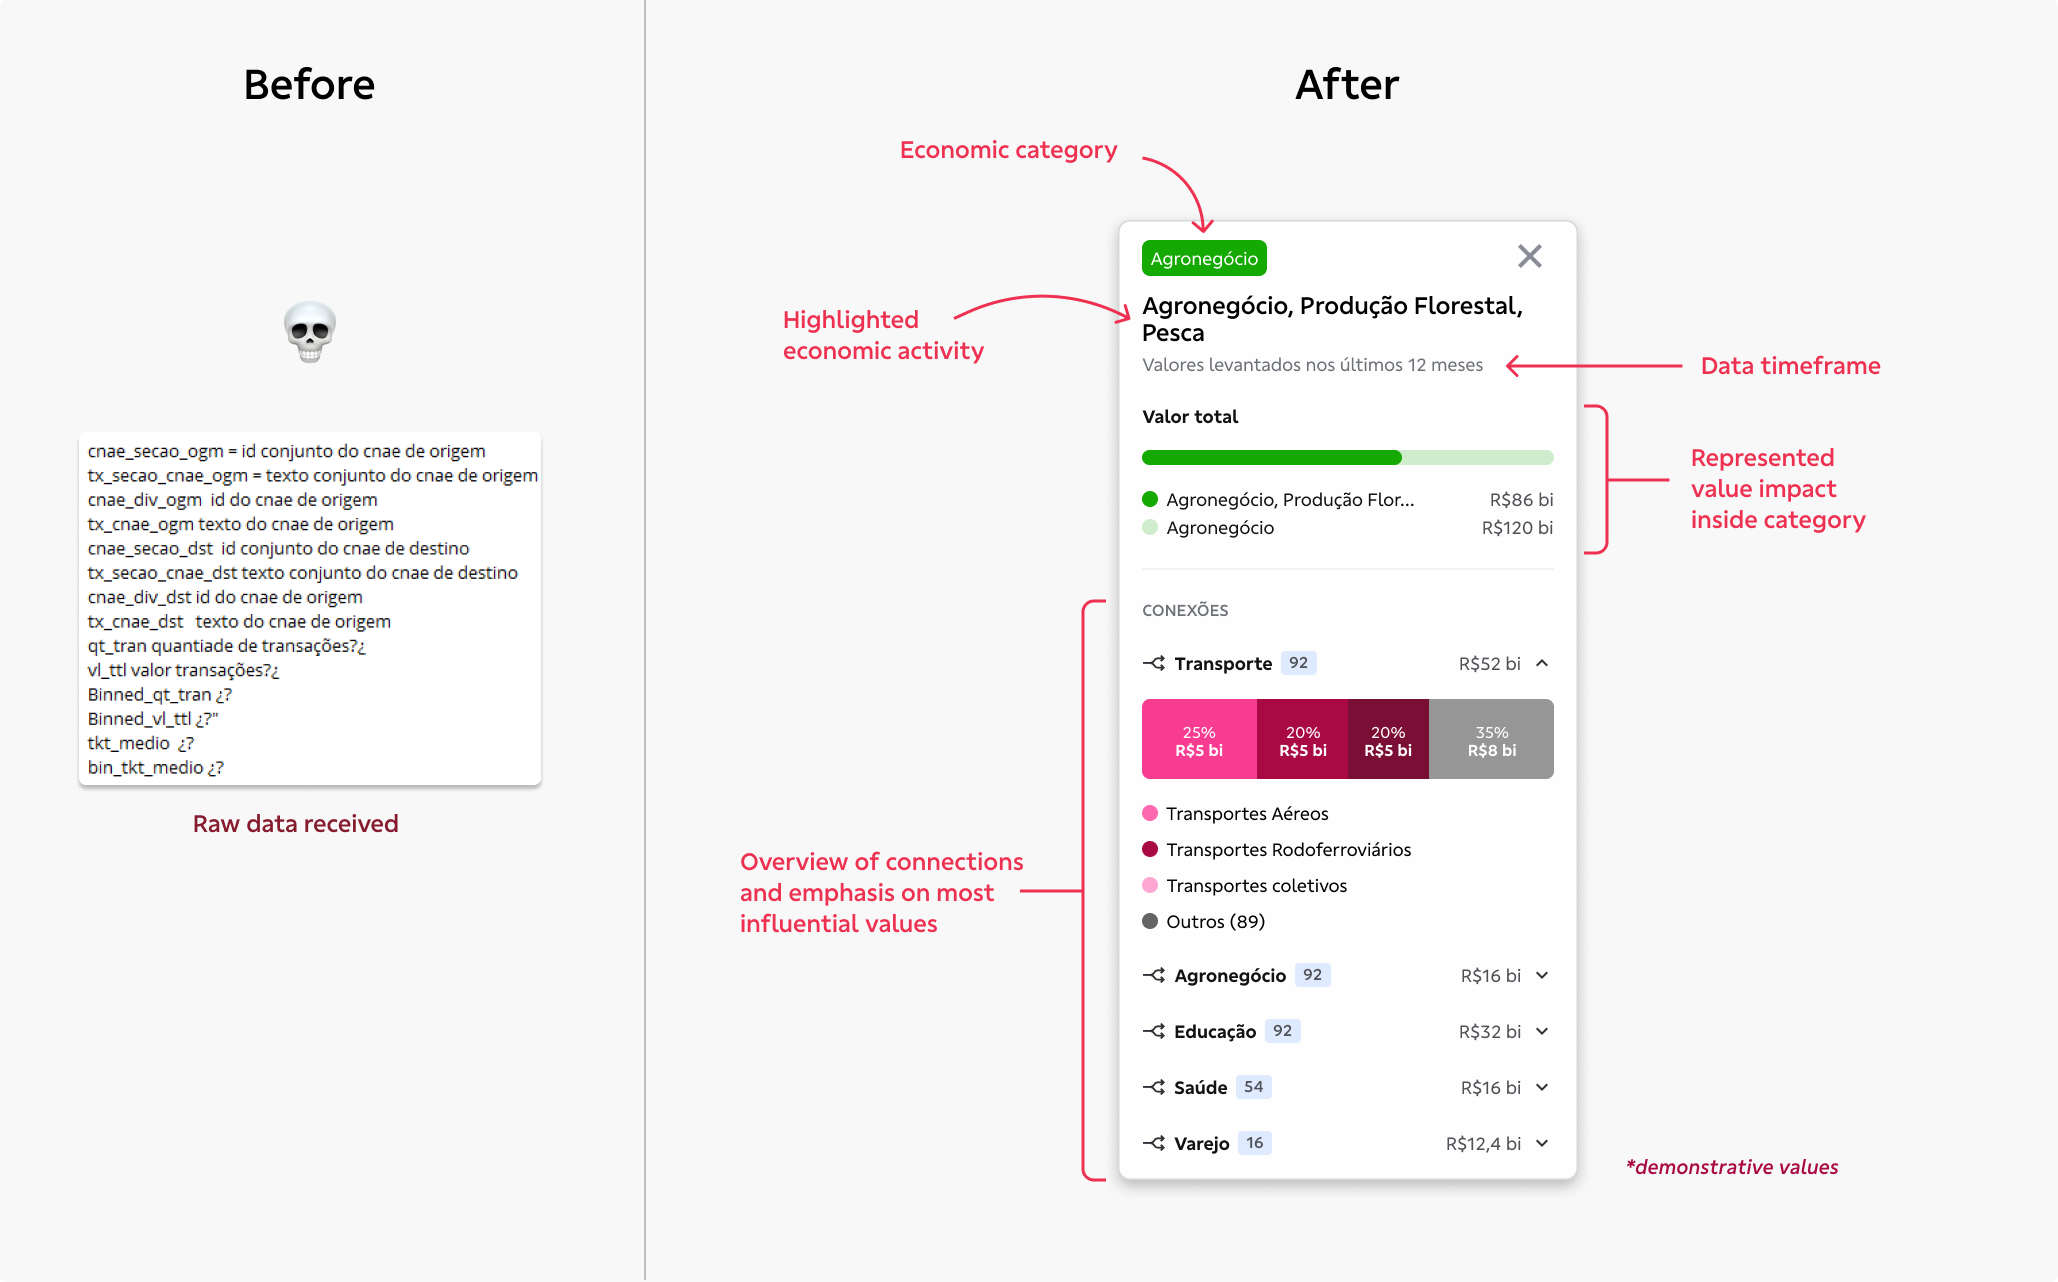
Information Architecture of refined UI over translated data
Digital Meets Analogical
Beyond the digital world, there was the challenge to spark the curiosity enough to make people want to interact with the experience during the showcasing of the solution.
Throughout the entire design process, numerous meetings were held to define the scope and directions of the experience, while assessing the budget and available resources. It was decided that the macroeconomic categories within the dataset would be represented by 3D-printed objects, bringing them to life and enabling direct interaction with the visualization tool.
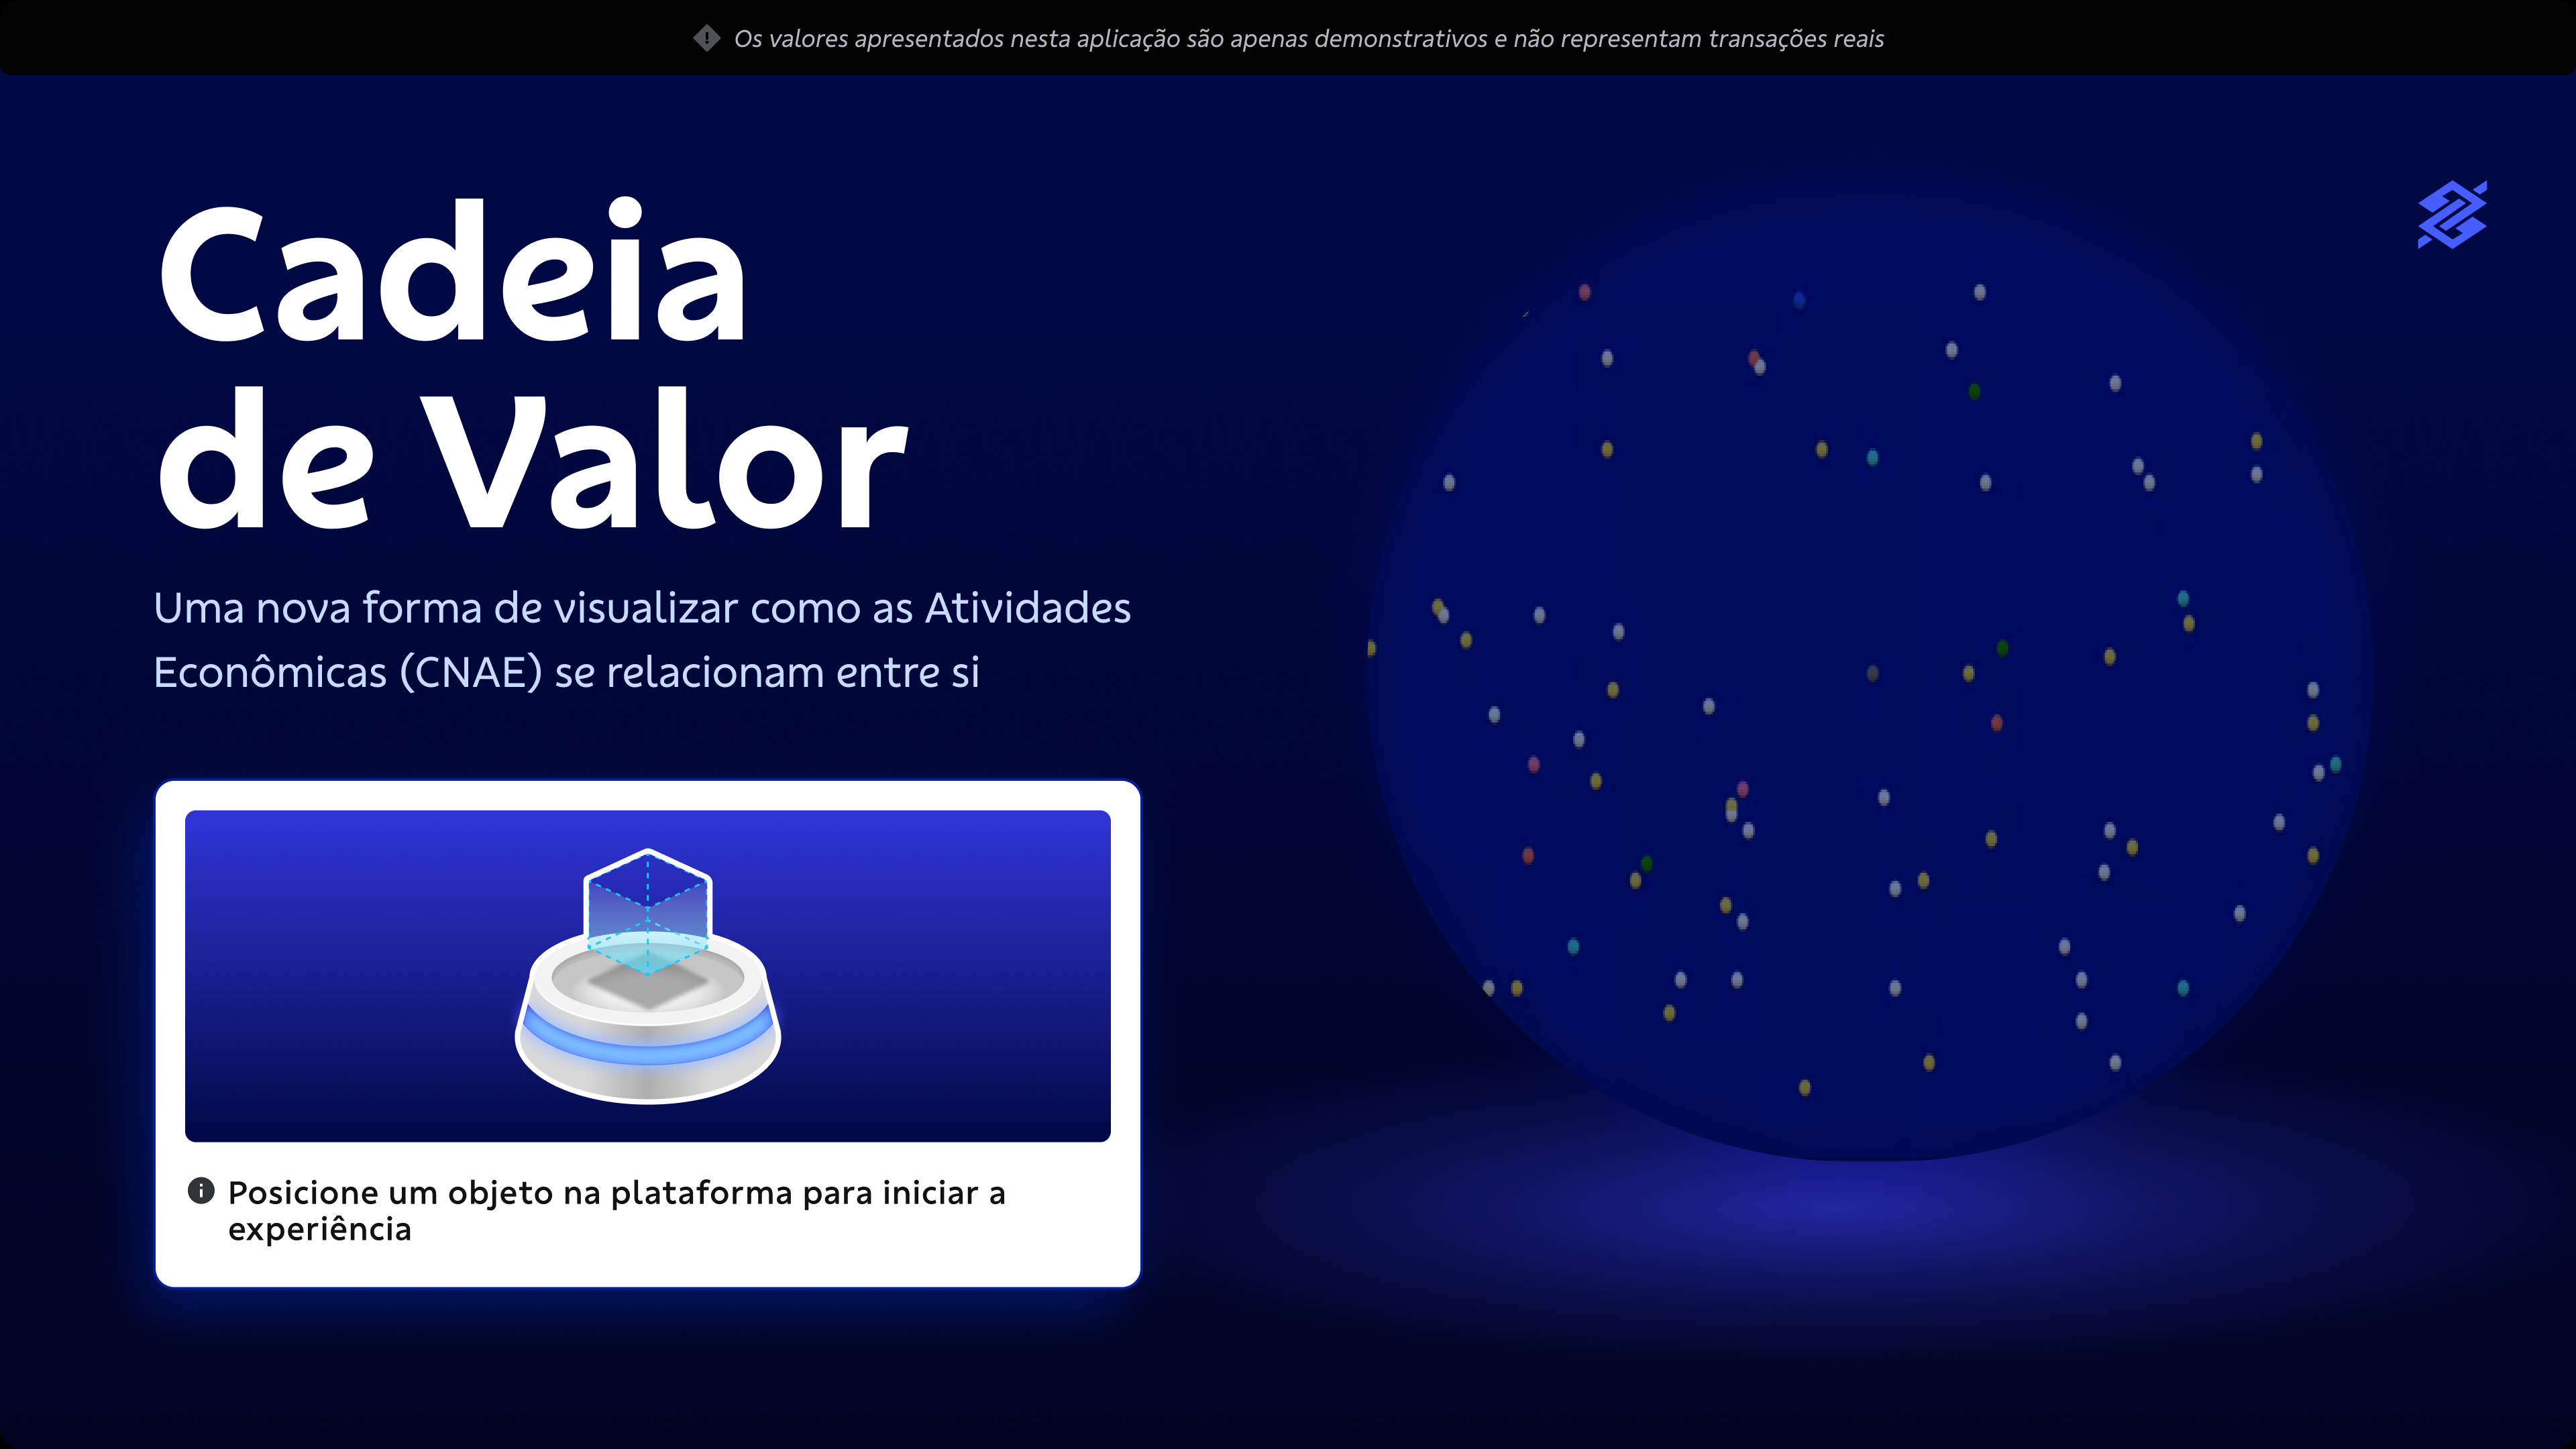
💡 How can we seamlessly integrate physical objects into the digital experience?
With RFID technology, users can trigger the experience and filter categories by placing the corresponding 3D-printed object onto an RFID-enabled base. This interaction stacks the views in the visualization tool in real-time. Each object was assigned a color, which lit up on the base as feedback, while the interactive monitor immediately highlighted the selected node and displayed its related information.
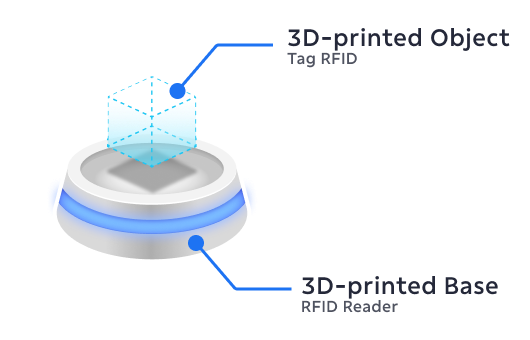
Technology structure for the RFID integration
Outcome
As a consequence of the design process, the initial tool went through a full-on makeover, emphasizing in making the complex phenomenon of Brazil's economic dynamics accessible for everyone and transforming the way people interact with information.
The project highlights how technology can enhance decision-making by providing clearer insights into economic transactions, bridging the gap between a complex world phenomenon and the general public. By visualizing complex data, it empowers users to better understand economic dynamics and relationships, ultimately leading to more informed decision-making and bringing value not only for Banco do Brasil, but potentially to the whole economic ecosystem.
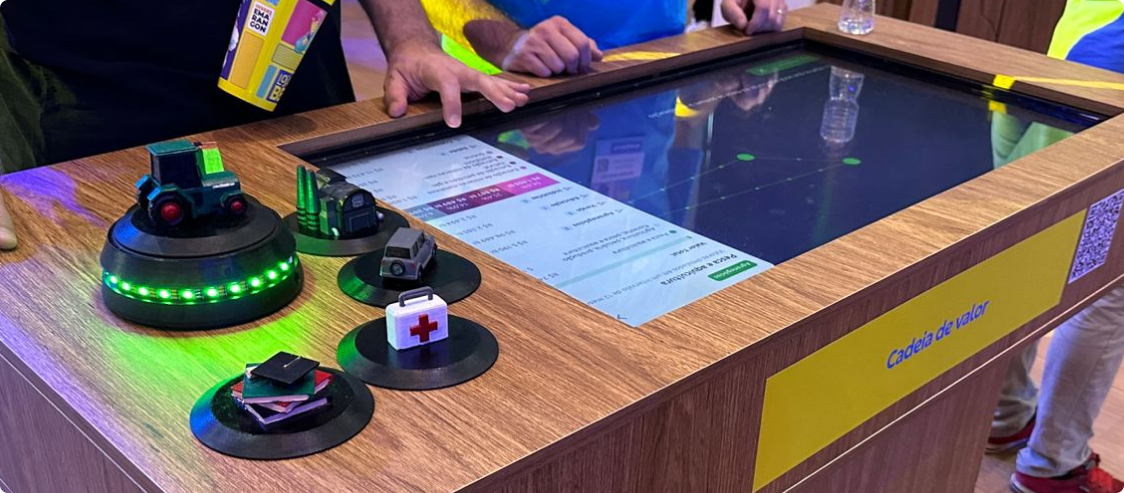
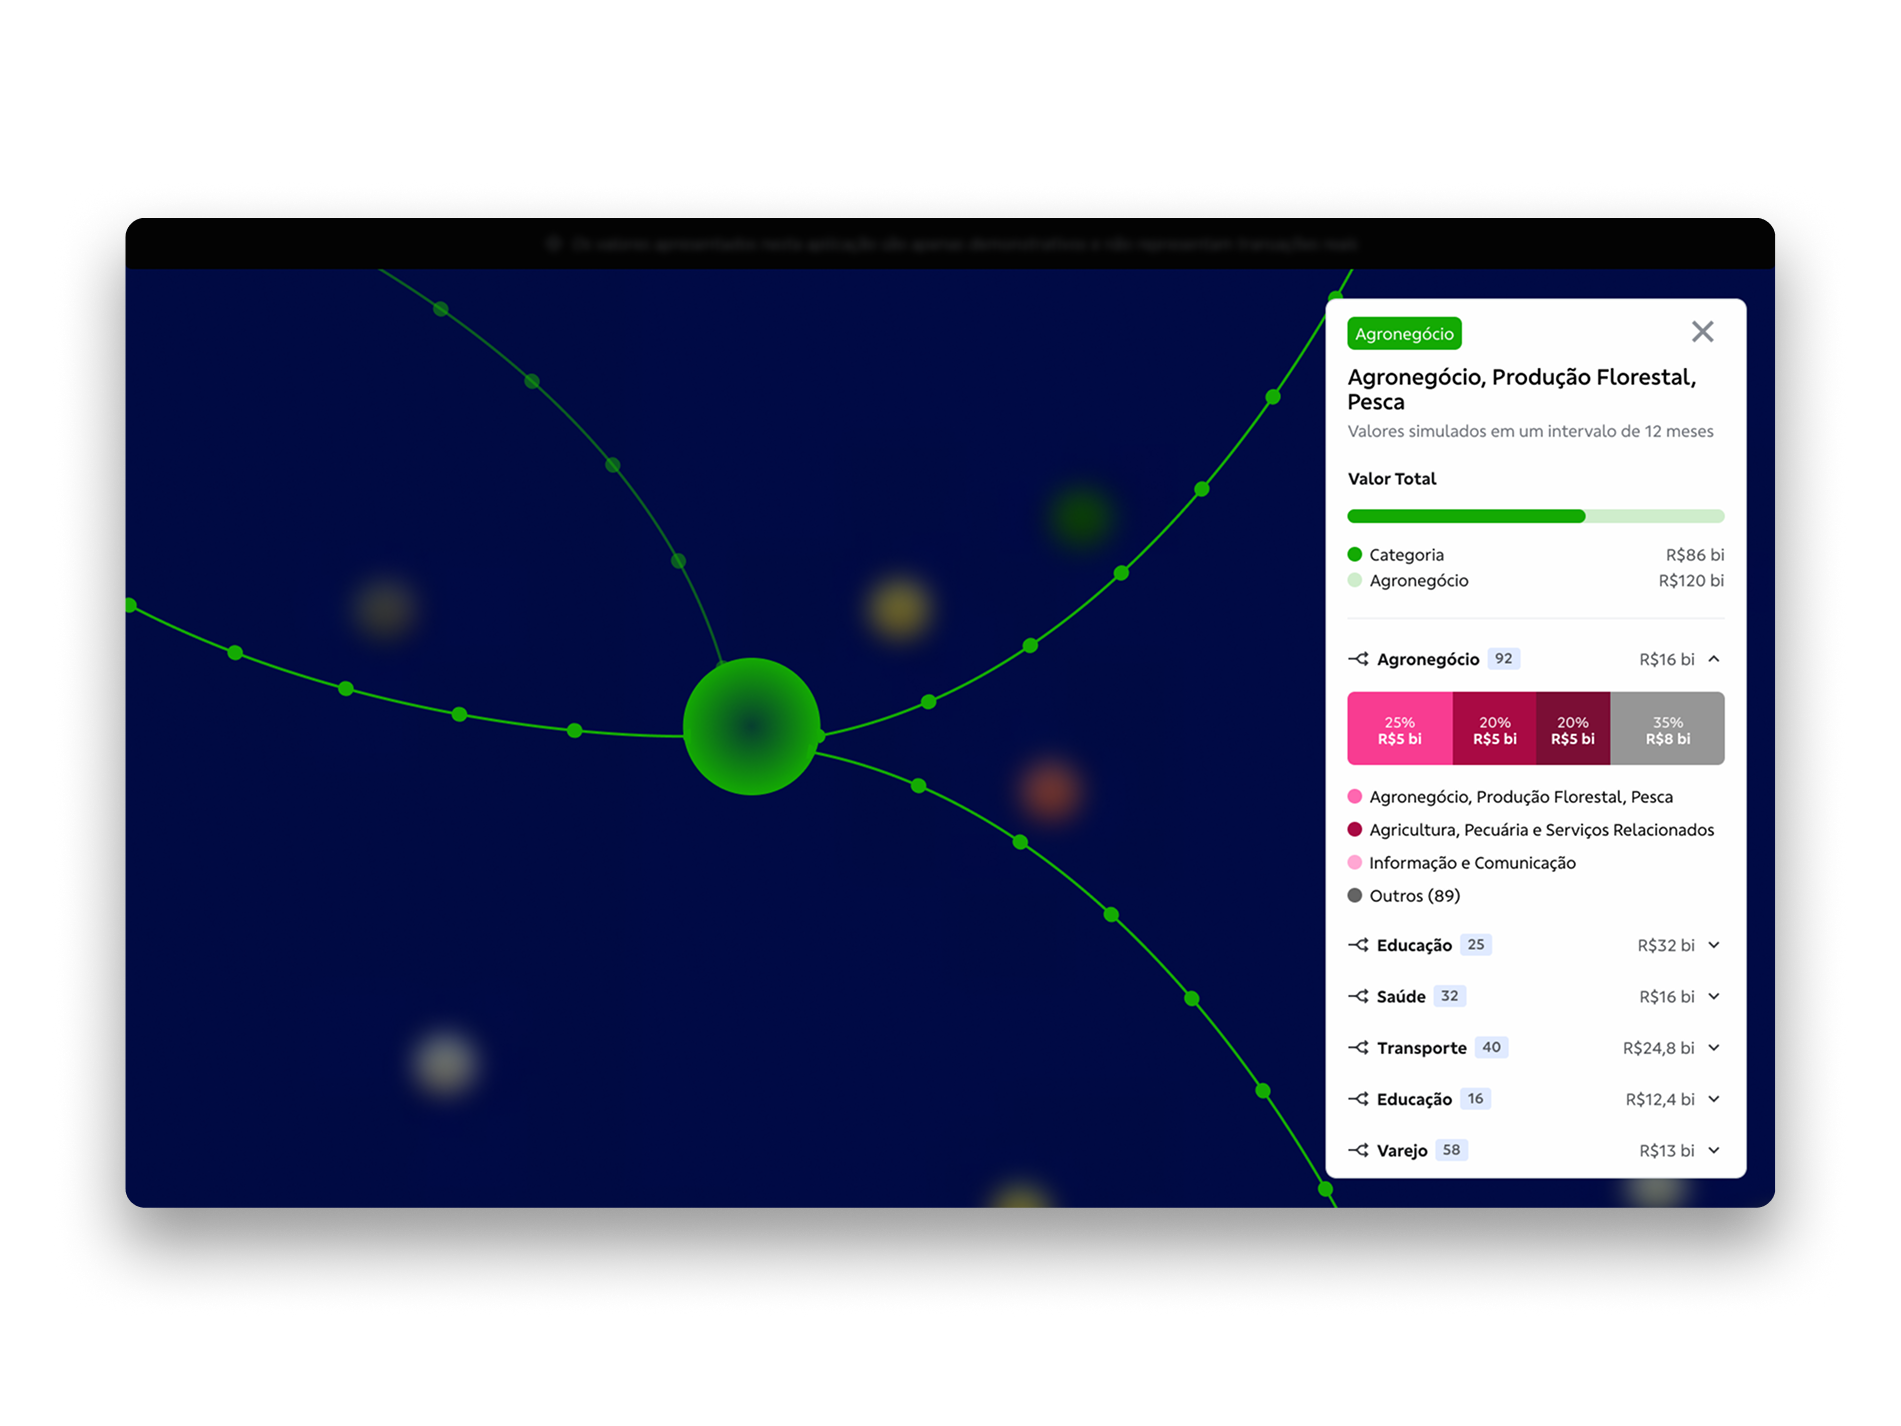
Prototype of RFID objects filtering category visualization
Stacked filtering visualization
Results
Improved Economic Insights
Thousands of interconnections at the CNAE level were successfully processed and translated visually, breaking down complex information and enabling a clearer understanding of financial relationships across sectors. This innovation .helped the organization better understand sectoral interconnections and support strategic decision-making.
Data Visualization as Interaction
Data visualization plays an important role on translating and breaking down complex information to general audience. By introducing an interactive graph-based interface, the project allows users to explore the connections between CNAE sectors in real-time easily and directly within the 3D Viewer.
Engagement Beyond Banking
By presenting the tool at innovation and technology conferences, the project reached a broader audience. This initiative reinforces Banco do Brasil's authority in digital transformation and reputation as a future-focused institution.
Open access to information
This project plays an important role on the democratization of information, assisting people with the analysis and understanding of how values navigate through brazilian economy, in a simple and intuitive way, even if they have no technical financial understanding.